29
/
en
AIzaSyAYiBZKx7MnpbEhh9jyipgxe19OcubqV5w
April 1, 2024
80046
Barbados
BRB
true
2
1
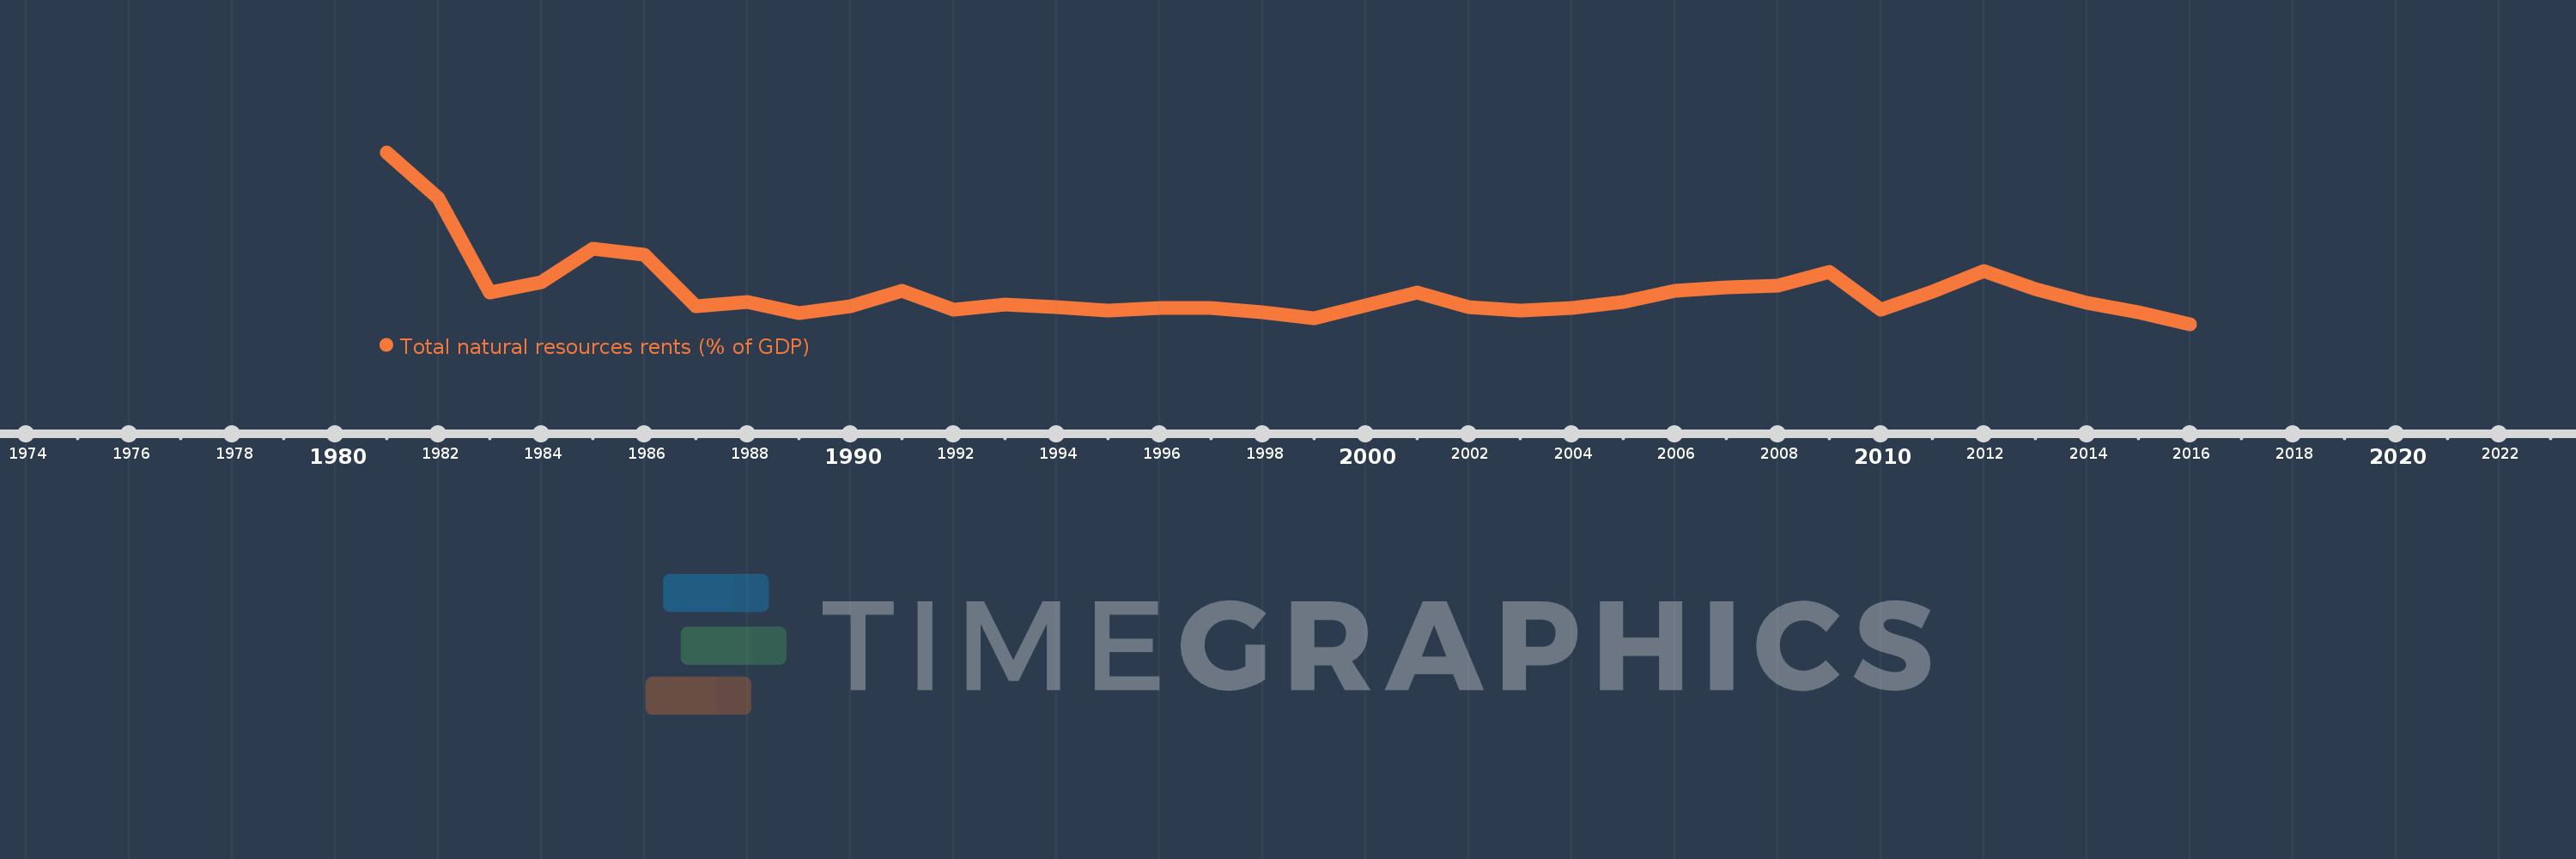
Total natural resources rents (% of GDP)
2016,2015,2014,2013,2012,2011,2010,2009,2008,2007,2006,2005,2004,2003,2002,2001,2000,1999,1998,1997,1996,1995,1994,1993,1992,1991,1990,1989,1988,1987,1986,1985,1984,1983,1982,1981
This statistics in other country:
AfghanistanAlbaniaAlgeriaAngolaArab WorldArgentinaArmeniaArubaAustraliaAustriaAzerbaijanBahamas, TheBahrainBangladeshBarbadosBelarusBelgiumBelizeBeninBhutanBoliviaBosnia and HerzegovinaBotswanaBrazilBrunei DarussalamBulgariaBurkina FasoBurundiCabo VerdeCambodiaCameroonCanadaCaribbean small statesCentral African RepublicCentral Europe and the BalticsChadChileChinaColombiaComorosCongo, Dem. Rep.Congo, Rep.Costa RicaCote d'IvoireCroatiaCubaCyprusCzech RepublicDenmarkDjiboutiDominicaDominican RepublicEarly-demographic dividendEast Asia & PacificEast Asia & Pacific (excluding high income)East Asia & Pacific (IDA & IBRD countries)EcuadorEgypt, Arab Rep.El SalvadorEquatorial GuineaEritreaEstoniaEthiopiaEuro areaEurope & Central AsiaEurope & Central Asia (excluding high income)Europe & Central Asia (IDA & IBRD countries)European UnionFijiFinlandFragile and conflict affected situationsFranceFrench PolynesiaGabonGambia, TheGeorgiaGermanyGhanaGreeceGuatemalaGuineaGuinea-BissauGuyanaHaitiHeavily indebted poor countries (HIPC)High incomeHondurasHong Kong SAR, ChinaHungaryIBRD onlyIcelandIDA & IBRD totalIDA blendIDA onlyIDA totalIndiaIndonesiaIran, Islamic Rep.IraqIrelandIsraelItalyJamaicaJapanJordanKazakhstanKenyaKiribatiKorea, Rep.KuwaitKyrgyz RepublicLao PDRLate-demographic dividendLatin America & Caribbean Latin America & Caribbean (excluding high income)Latin America & the Caribbean (IDA & IBRD countries)LatviaLeast developed countries: UN classificationLebanonLesothoLiberiaLibyaLithuaniaLow & middle incomeLow incomeLower middle incomeLuxembourgMacao SAR, ChinaMacedonia, FYRMadagascarMalawiMalaysiaMaldivesMaliMaltaMauritaniaMauritiusMexicoMiddle East & North AfricaMiddle East & North Africa (excluding high income)Middle East & North Africa (IDA & IBRD countries)Middle incomeMoldovaMongoliaMontenegroMoroccoMozambiqueMyanmarNamibiaNepalNetherlandsNew CaledoniaNew ZealandNicaraguaNigerNigeriaNorth AmericaNorwayOECD membersOmanOther small statesPacific island small statesPakistanPanamaPapua New GuineaParaguayPeruPhilippinesPolandPortugalPost-demographic dividendPre-demographic dividendQatarRomaniaRussian FederationRwandaSamoaSao Tome and PrincipeSaudi ArabiaSenegalSerbiaSeychellesSierra LeoneSingaporeSlovak RepublicSloveniaSmall statesSolomon IslandsSouth AfricaSouth AsiaSouth Asia (IDA & IBRD)South SudanSpainSri LankaSt. LuciaSt. Vincent and the GrenadinesSub-Saharan Africa Sub-Saharan Africa (excluding high income)Sub-Saharan Africa (IDA & IBRD countries)SudanSurinameSwazilandSwedenSwitzerlandSyrian Arab RepublicTajikistanTanzaniaThailandTimor-LesteTogoTongaTrinidad and TobagoTunisiaTurkeyTurkmenistanUgandaUkraineUnited Arab EmiratesUnited KingdomUnited StatesUpper middle incomeUruguayUzbekistanVanuatuVenezuela, RBVietnamWorldYemen, Rep.ZambiaZimbabwe Timeline:
This timeline shows a graph from 1981 to 2016 of Barbados. No data until 1980. Number of actual observations by date: 36.
Source name:
World Development Indicators
Source organization:
Estimates based on sources and methods described in "The Changing Wealth of Nations: Measuring Sustainable Development in the New Millennium" (World Bank, 2011).
Categories, topics:
Energy & Mining, Environment
Last updated:
apr 23, 2017
Indicators value changes by year
At the date of observation
Value
Absolute change
Change from previous value
jan 1, 1981
1.652
+1.652
0.0%
jan 1, 1982
1.23
-0.423
-25.58%
jan 1, 1983
0.346
-0.884
-71.86%
jan 1, 1984
0.444
+0.098
28.2%
jan 1, 1985
0.758
+0.314
70.78%
jan 1, 1986
0.699
-0.058
-7.69%
jan 1, 1987
0.216
-0.483
-69.04%
jan 1, 1988
0.258
+0.042
19.39%
jan 1, 1989
0.158
-0.101
-38.96%
jan 1, 1990
0.215
+0.057
35.96%
jan 1, 1991
0.363
+0.149
69.35%
jan 1, 1992
0.185
-0.178
-48.95%
jan 1, 1993
0.235
+0.049
26.58%
jan 1, 1994
0.212
-0.023
-9.64%
jan 1, 1995
0.178
-0.034
-15.91%
jan 1, 1996
0.205
+0.026
14.78%
jan 1, 1997
0.203
-0.002
-0.97%
jan 1, 1998
0.162
-0.041
-20.14%
jan 1, 1999
0.103
-0.059
-36.62%
jan 1, 2000
0.226
+0.123
119.91%
jan 1, 2001
0.344
+0.118
52.35%
jan 1, 2002
0.209
-0.135
-39.32%
jan 1, 2003
0.176
-0.032
-15.49%
jan 1, 2004
0.204
+0.028
15.7%
jan 1, 2005
0.258
+0.054
26.31%
jan 1, 2006
0.36
+0.103
39.8%
jan 1, 2007
0.394
+0.034
9.36%
jan 1, 2008
0.409
+0.015
3.77%
jan 1, 2009
0.539
+0.13
31.87%
jan 1, 2010
0.188
-0.351
-65.04%
jan 1, 2011
0.354
+0.165
87.73%
jan 1, 2012
0.548
+0.195
55.01%
jan 1, 2013
0.375
-0.173
-31.58%
jan 1, 2014
0.247
-0.128
-34.11%
jan 1, 2015
0.163
-0.084
-34.13%
jan 1, 2016
0.051
-0.112
-68.8%
Ranking of countries by current statistics by years


Comments: