29
/
en
AIzaSyAYiBZKx7MnpbEhh9jyipgxe19OcubqV5w
April 1, 2024
277209
United States
USA
true
2
1
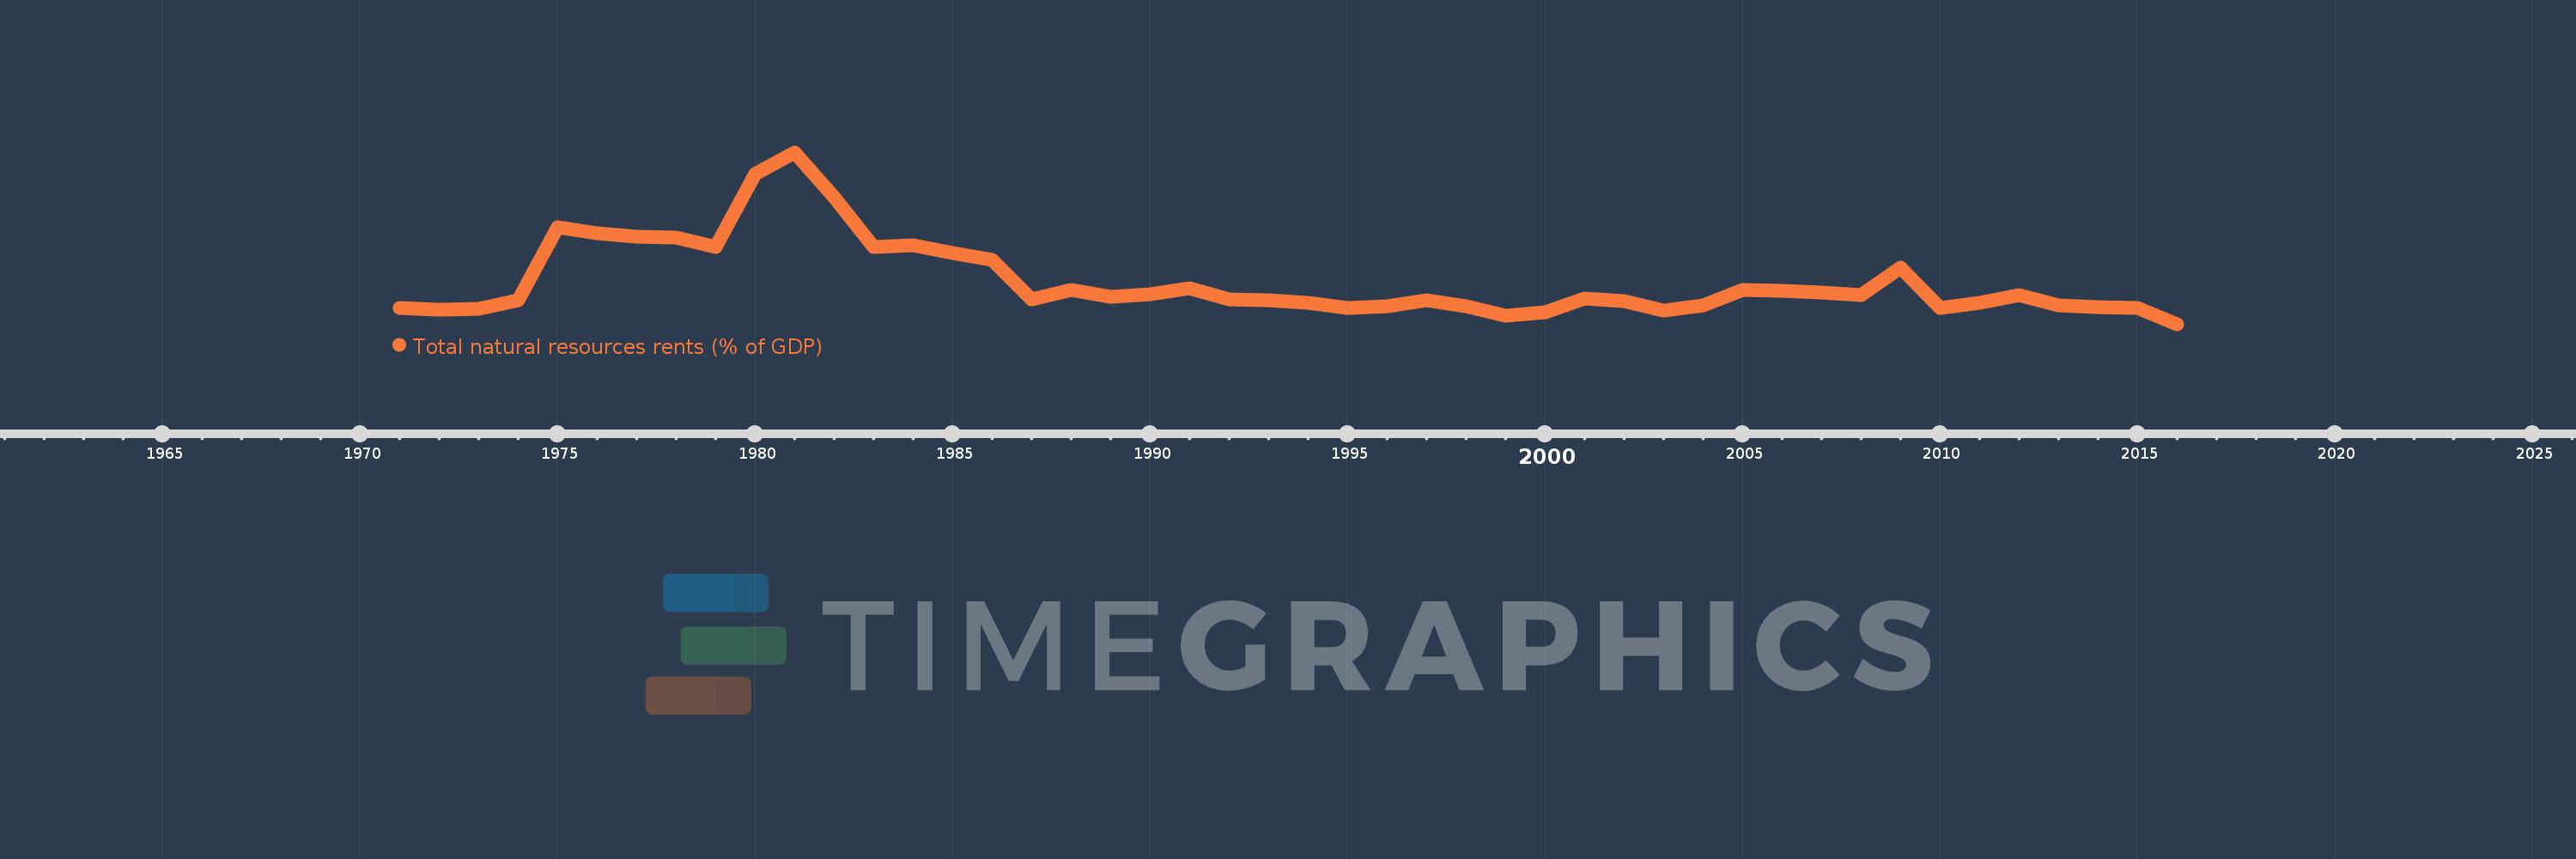
Total natural resources rents (% of GDP)
2016,2015,2014,2013,2012,2011,2010,2009,2008,2007,2006,2005,2004,2003,2002,2001,2000,1999,1998,1997,1996,1995,1994,1993,1992,1991,1990,1989,1988,1987,1986,1985,1984,1983,1982,1981,1980,1979,1978,1977,1976,1975,1974,1973,1972,1971
This statistics in other country:
AfghanistanAlbaniaAlgeriaAngolaArab WorldArgentinaArmeniaArubaAustraliaAustriaAzerbaijanBahamas, TheBahrainBangladeshBarbadosBelarusBelgiumBelizeBeninBhutanBoliviaBosnia and HerzegovinaBotswanaBrazilBrunei DarussalamBulgariaBurkina FasoBurundiCabo VerdeCambodiaCameroonCanadaCaribbean small statesCentral African RepublicCentral Europe and the BalticsChadChileChinaColombiaComorosCongo, Dem. Rep.Congo, Rep.Costa RicaCote d'IvoireCroatiaCubaCyprusCzech RepublicDenmarkDjiboutiDominicaDominican RepublicEarly-demographic dividendEast Asia & PacificEast Asia & Pacific (excluding high income)East Asia & Pacific (IDA & IBRD countries)EcuadorEgypt, Arab Rep.El SalvadorEquatorial GuineaEritreaEstoniaEthiopiaEuro areaEurope & Central AsiaEurope & Central Asia (excluding high income)Europe & Central Asia (IDA & IBRD countries)European UnionFijiFinlandFragile and conflict affected situationsFranceFrench PolynesiaGabonGambia, TheGeorgiaGermanyGhanaGreeceGuatemalaGuineaGuinea-BissauGuyanaHaitiHeavily indebted poor countries (HIPC)High incomeHondurasHong Kong SAR, ChinaHungaryIBRD onlyIcelandIDA & IBRD totalIDA blendIDA onlyIDA totalIndiaIndonesiaIran, Islamic Rep.IraqIrelandIsraelItalyJamaicaJapanJordanKazakhstanKenyaKiribatiKorea, Rep.KuwaitKyrgyz RepublicLao PDRLate-demographic dividendLatin America & Caribbean Latin America & Caribbean (excluding high income)Latin America & the Caribbean (IDA & IBRD countries)LatviaLeast developed countries: UN classificationLebanonLesothoLiberiaLibyaLithuaniaLow & middle incomeLow incomeLower middle incomeLuxembourgMacao SAR, ChinaMacedonia, FYRMadagascarMalawiMalaysiaMaldivesMaliMaltaMauritaniaMauritiusMexicoMiddle East & North AfricaMiddle East & North Africa (excluding high income)Middle East & North Africa (IDA & IBRD countries)Middle incomeMoldovaMongoliaMontenegroMoroccoMozambiqueMyanmarNamibiaNepalNetherlandsNew CaledoniaNew ZealandNicaraguaNigerNigeriaNorth AmericaNorwayOECD membersOmanOther small statesPacific island small statesPakistanPanamaPapua New GuineaParaguayPeruPhilippinesPolandPortugalPost-demographic dividendPre-demographic dividendQatarRomaniaRussian FederationRwandaSamoaSao Tome and PrincipeSaudi ArabiaSenegalSerbiaSeychellesSierra LeoneSingaporeSlovak RepublicSloveniaSmall statesSolomon IslandsSouth AfricaSouth AsiaSouth Asia (IDA & IBRD)South SudanSpainSri LankaSt. LuciaSt. Vincent and the GrenadinesSub-Saharan Africa Sub-Saharan Africa (excluding high income)Sub-Saharan Africa (IDA & IBRD countries)SudanSurinameSwazilandSwedenSwitzerlandSyrian Arab RepublicTajikistanTanzaniaThailandTimor-LesteTogoTongaTrinidad and TobagoTunisiaTurkeyTurkmenistanUgandaUkraineUnited Arab EmiratesUnited KingdomUnited StatesUpper middle incomeUruguayUzbekistanVanuatuVenezuela, RBVietnamWorldYemen, Rep.ZambiaZimbabwe Timeline:
This timeline shows a graph from 1971 to 2016 of United States. No data until 1970. Number of actual observations by date: 46.
Source name:
World Development Indicators
Source organization:
Estimates based on sources and methods described in "The Changing Wealth of Nations: Measuring Sustainable Development in the New Millennium" (World Bank, 2011).
Categories, topics:
Energy & Mining, Environment
Last updated:
apr 23, 2017
Indicators value changes by year
At the date of observation
Value
Absolute change
Change from previous value
jan 1, 1971
0.794
+0.794
0.0%
jan 1, 1972
0.757
-0.037
-4.6%
jan 1, 1973
0.785
+0.028
3.69%
jan 1, 1974
1.04
+0.255
32.45%
jan 1, 1975
3.362
+2.322
223.3%
jan 1, 1976
3.197
-0.165
-4.9%
jan 1, 1977
3.069
-0.129
-4.03%
jan 1, 1978
3.058
-0.011
-0.37%
jan 1, 1979
2.739
-0.319
-10.43%
jan 1, 1980
5.082
+2.344
85.59%
jan 1, 1981
5.756
+0.674
13.26%
jan 1, 1982
4.324
-1.433
-24.89%
jan 1, 1983
2.742
-1.581
-36.57%
jan 1, 1984
2.794
+0.051
1.87%
jan 1, 1985
2.567
-0.226
-8.1%
jan 1, 1986
2.342
-0.225
-8.78%
jan 1, 1987
1.086
-1.256
-53.64%
jan 1, 1988
1.381
+0.295
27.21%
jan 1, 1989
1.158
-0.223
-16.13%
jan 1, 1990
1.252
+0.094
8.09%
jan 1, 1991
1.423
+0.171
13.66%
jan 1, 1992
1.07
-0.353
-24.82%
jan 1, 1993
1.051
-0.019
-1.76%
jan 1, 1994
0.964
-0.087
-8.28%
jan 1, 1995
0.802
-0.162
-16.81%
jan 1, 1996
0.849
+0.047
5.83%
jan 1, 1997
1.044
+0.195
22.97%
jan 1, 1998
0.851
-0.193
-18.45%
jan 1, 1999
0.548
-0.304
-35.67%
jan 1, 2000
0.657
+0.11
20.08%
jan 1, 2001
1.102
+0.445
67.67%
jan 1, 2002
1.038
-0.064
-5.84%
jan 1, 2003
0.73
-0.308
-29.7%
jan 1, 2004
0.887
+0.158
21.58%
jan 1, 2005
1.374
+0.487
54.9%
jan 1, 2006
1.345
-0.03
-2.16%
jan 1, 2007
1.285
-0.06
-4.45%
jan 1, 2008
1.214
-0.071
-5.49%
jan 1, 2009
2.102
+0.888
73.14%
jan 1, 2010
0.806
-1.296
-61.66%
jan 1, 2011
0.982
+0.176
21.88%
jan 1, 2012
1.217
+0.235
23.91%
jan 1, 2013
0.875
-0.342
-28.12%
jan 1, 2014
0.843
-0.032
-3.66%
jan 1, 2015
0.808
-0.035
-4.14%
jan 1, 2016
0.29
-0.518
-64.11%
Ranking of countries by current statistics by years


Comments: