29
/
en
AIzaSyAYiBZKx7MnpbEhh9jyipgxe19OcubqV5w
April 1, 2024
32278
Europe & Central Asia (excluding high income)
ECA
false
2
1
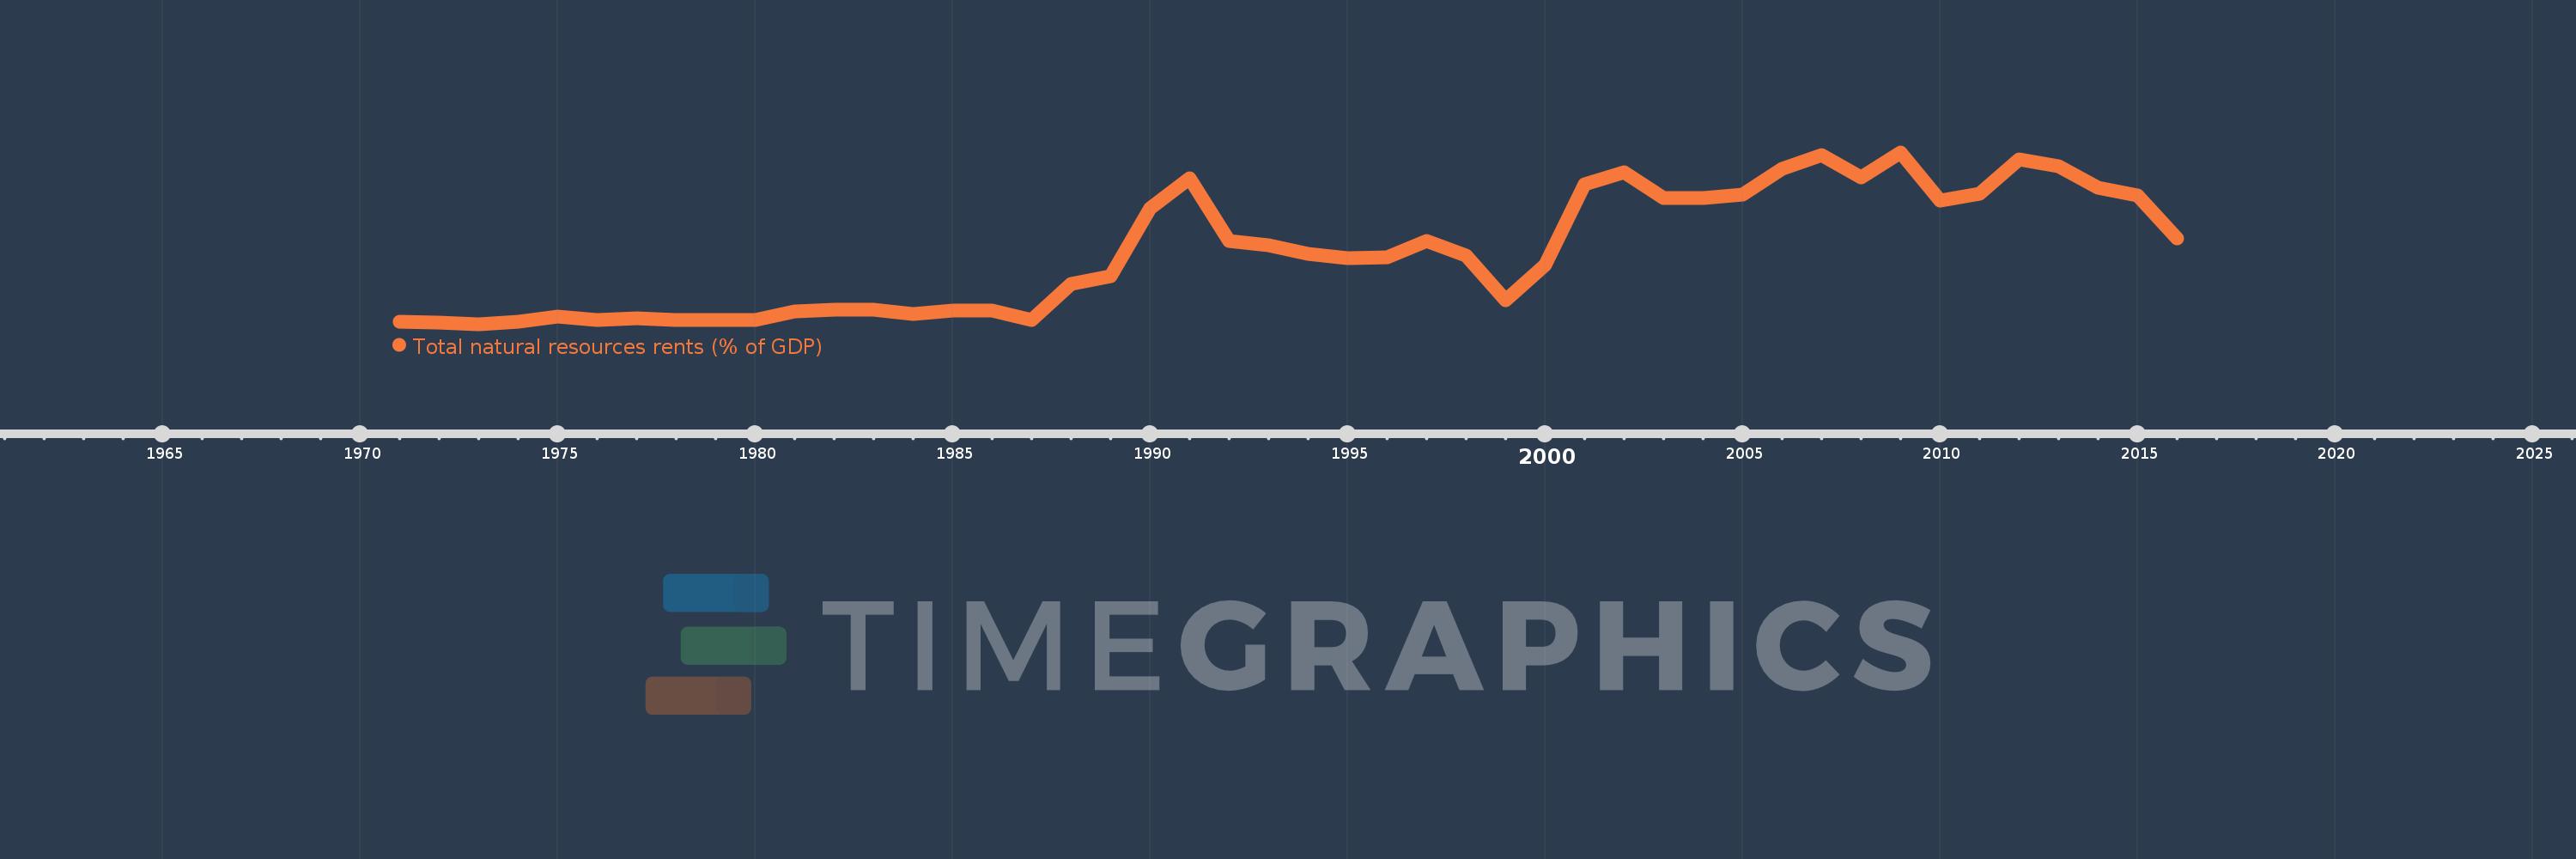
Total natural resources rents (% of GDP)
2016,2015,2014,2013,2012,2011,2010,2009,2008,2007,2006,2005,2004,2003,2002,2001,2000,1999,1998,1997,1996,1995,1994,1993,1992,1991,1990,1989,1988,1987,1986,1985,1984,1983,1982,1981,1980,1979,1978,1977,1976,1975,1974,1973,1972,1971
This statistics in other country:
AfghanistanAlbaniaAlgeriaAngolaArab WorldArgentinaArmeniaArubaAustraliaAustriaAzerbaijanBahamas, TheBahrainBangladeshBarbadosBelarusBelgiumBelizeBeninBhutanBoliviaBosnia and HerzegovinaBotswanaBrazilBrunei DarussalamBulgariaBurkina FasoBurundiCabo VerdeCambodiaCameroonCanadaCaribbean small statesCentral African RepublicCentral Europe and the BalticsChadChileChinaColombiaComorosCongo, Dem. Rep.Congo, Rep.Costa RicaCote d'IvoireCroatiaCubaCyprusCzech RepublicDenmarkDjiboutiDominicaDominican RepublicEarly-demographic dividendEast Asia & PacificEast Asia & Pacific (excluding high income)East Asia & Pacific (IDA & IBRD countries)EcuadorEgypt, Arab Rep.El SalvadorEquatorial GuineaEritreaEstoniaEthiopiaEuro areaEurope & Central AsiaEurope & Central Asia (excluding high income)Europe & Central Asia (IDA & IBRD countries)European UnionFijiFinlandFragile and conflict affected situationsFranceFrench PolynesiaGabonGambia, TheGeorgiaGermanyGhanaGreeceGuatemalaGuineaGuinea-BissauGuyanaHaitiHeavily indebted poor countries (HIPC)High incomeHondurasHong Kong SAR, ChinaHungaryIBRD onlyIcelandIDA & IBRD totalIDA blendIDA onlyIDA totalIndiaIndonesiaIran, Islamic Rep.IraqIrelandIsraelItalyJamaicaJapanJordanKazakhstanKenyaKiribatiKorea, Rep.KuwaitKyrgyz RepublicLao PDRLate-demographic dividendLatin America & Caribbean Latin America & Caribbean (excluding high income)Latin America & the Caribbean (IDA & IBRD countries)LatviaLeast developed countries: UN classificationLebanonLesothoLiberiaLibyaLithuaniaLow & middle incomeLow incomeLower middle incomeLuxembourgMacao SAR, ChinaMacedonia, FYRMadagascarMalawiMalaysiaMaldivesMaliMaltaMauritaniaMauritiusMexicoMiddle East & North AfricaMiddle East & North Africa (excluding high income)Middle East & North Africa (IDA & IBRD countries)Middle incomeMoldovaMongoliaMontenegroMoroccoMozambiqueMyanmarNamibiaNepalNetherlandsNew CaledoniaNew ZealandNicaraguaNigerNigeriaNorth AmericaNorwayOECD membersOmanOther small statesPacific island small statesPakistanPanamaPapua New GuineaParaguayPeruPhilippinesPolandPortugalPost-demographic dividendPre-demographic dividendQatarRomaniaRussian FederationRwandaSamoaSao Tome and PrincipeSaudi ArabiaSenegalSerbiaSeychellesSierra LeoneSingaporeSlovak RepublicSloveniaSmall statesSolomon IslandsSouth AfricaSouth AsiaSouth Asia (IDA & IBRD)South SudanSpainSri LankaSt. LuciaSt. Vincent and the GrenadinesSub-Saharan Africa Sub-Saharan Africa (excluding high income)Sub-Saharan Africa (IDA & IBRD countries)SudanSurinameSwazilandSwedenSwitzerlandSyrian Arab RepublicTajikistanTanzaniaThailandTimor-LesteTogoTongaTrinidad and TobagoTunisiaTurkeyTurkmenistanUgandaUkraineUnited Arab EmiratesUnited KingdomUnited StatesUpper middle incomeUruguayUzbekistanVanuatuVenezuela, RBVietnamWorldYemen, Rep.ZambiaZimbabwe Timeline:
This timeline shows a graph from 1971 to 2016 of Europe & Central Asia (excluding high income). No data until 1970. Number of actual observations by date: 46.
Source name:
World Development Indicators
Source organization:
Estimates based on sources and methods described in "The Changing Wealth of Nations: Measuring Sustainable Development in the New Millennium" (World Bank, 2011).
Categories, topics:
Energy & Mining, Environment
Last updated:
apr 23, 2017
Indicators value changes by year
Maximum:
12.508
jan 1, 2009
At the date of observation
Value
Absolute change
Change from previous value
jan 1, 1971
0.676
+0.676
0.0%
jan 1, 1972
0.609
-0.068
-9.99%
jan 1, 1973
0.517
-0.092
-15.05%
jan 1, 1974
0.688
+0.171
33.13%
jan 1, 1975
1.031
+0.343
49.8%
jan 1, 1976
0.828
-0.204
-19.74%
jan 1, 1977
0.914
+0.086
10.37%
jan 1, 1978
0.795
-0.119
-13.0%
jan 1, 1979
0.784
-0.011
-1.32%
jan 1, 1980
0.803
+0.018
2.32%
jan 1, 1981
1.437
+0.635
79.07%
jan 1, 1982
1.544
+0.107
7.45%
jan 1, 1983
1.54
-0.004
-0.28%
jan 1, 1984
1.211
-0.329
-21.37%
jan 1, 1985
1.482
+0.271
22.41%
jan 1, 1986
1.451
-0.032
-2.13%
jan 1, 1987
0.83
-0.62
-42.75%
jan 1, 1988
3.313
+2.482
298.88%
jan 1, 1989
3.86
+0.548
16.53%
jan 1, 1990
8.615
+4.754
123.16%
jan 1, 1991
10.706
+2.092
24.28%
jan 1, 1992
6.341
-4.365
-40.77%
jan 1, 1993
6.015
-0.326
-5.14%
jan 1, 1994
5.441
-0.574
-9.55%
jan 1, 1995
5.154
-0.287
-5.27%
jan 1, 1996
5.198
+0.044
0.85%
jan 1, 1997
6.338
+1.14
21.92%
jan 1, 1998
5.296
-1.041
-16.43%
jan 1, 1999
2.178
-3.118
-58.88%
jan 1, 2000
4.619
+2.441
112.08%
jan 1, 2001
10.283
+5.663
122.6%
jan 1, 2002
11.102
+0.819
7.97%
jan 1, 2003
9.331
-1.771
-15.95%
jan 1, 2004
9.334
+0.003
0.03%
jan 1, 2005
9.577
+0.243
2.61%
jan 1, 2006
11.391
+1.814
18.94%
jan 1, 2007
12.318
+0.927
8.14%
jan 1, 2008
10.779
-1.539
-12.49%
jan 1, 2009
12.508
+1.729
16.04%
jan 1, 2010
9.164
-3.344
-26.74%
jan 1, 2011
9.631
+0.468
5.1%
jan 1, 2012
12.016
+2.385
24.76%
jan 1, 2013
11.57
-0.446
-3.72%
jan 1, 2014
10.045
-1.524
-13.17%
jan 1, 2015
9.524
-0.521
-5.19%
jan 1, 2016
6.489
-3.035
-31.87%
Ranking of countries by current statistics by years


Comments: