29
/
en
AIzaSyAYiBZKx7MnpbEhh9jyipgxe19OcubqV5w
April 1, 2024
179615
Liberia
LBR
true
2
1
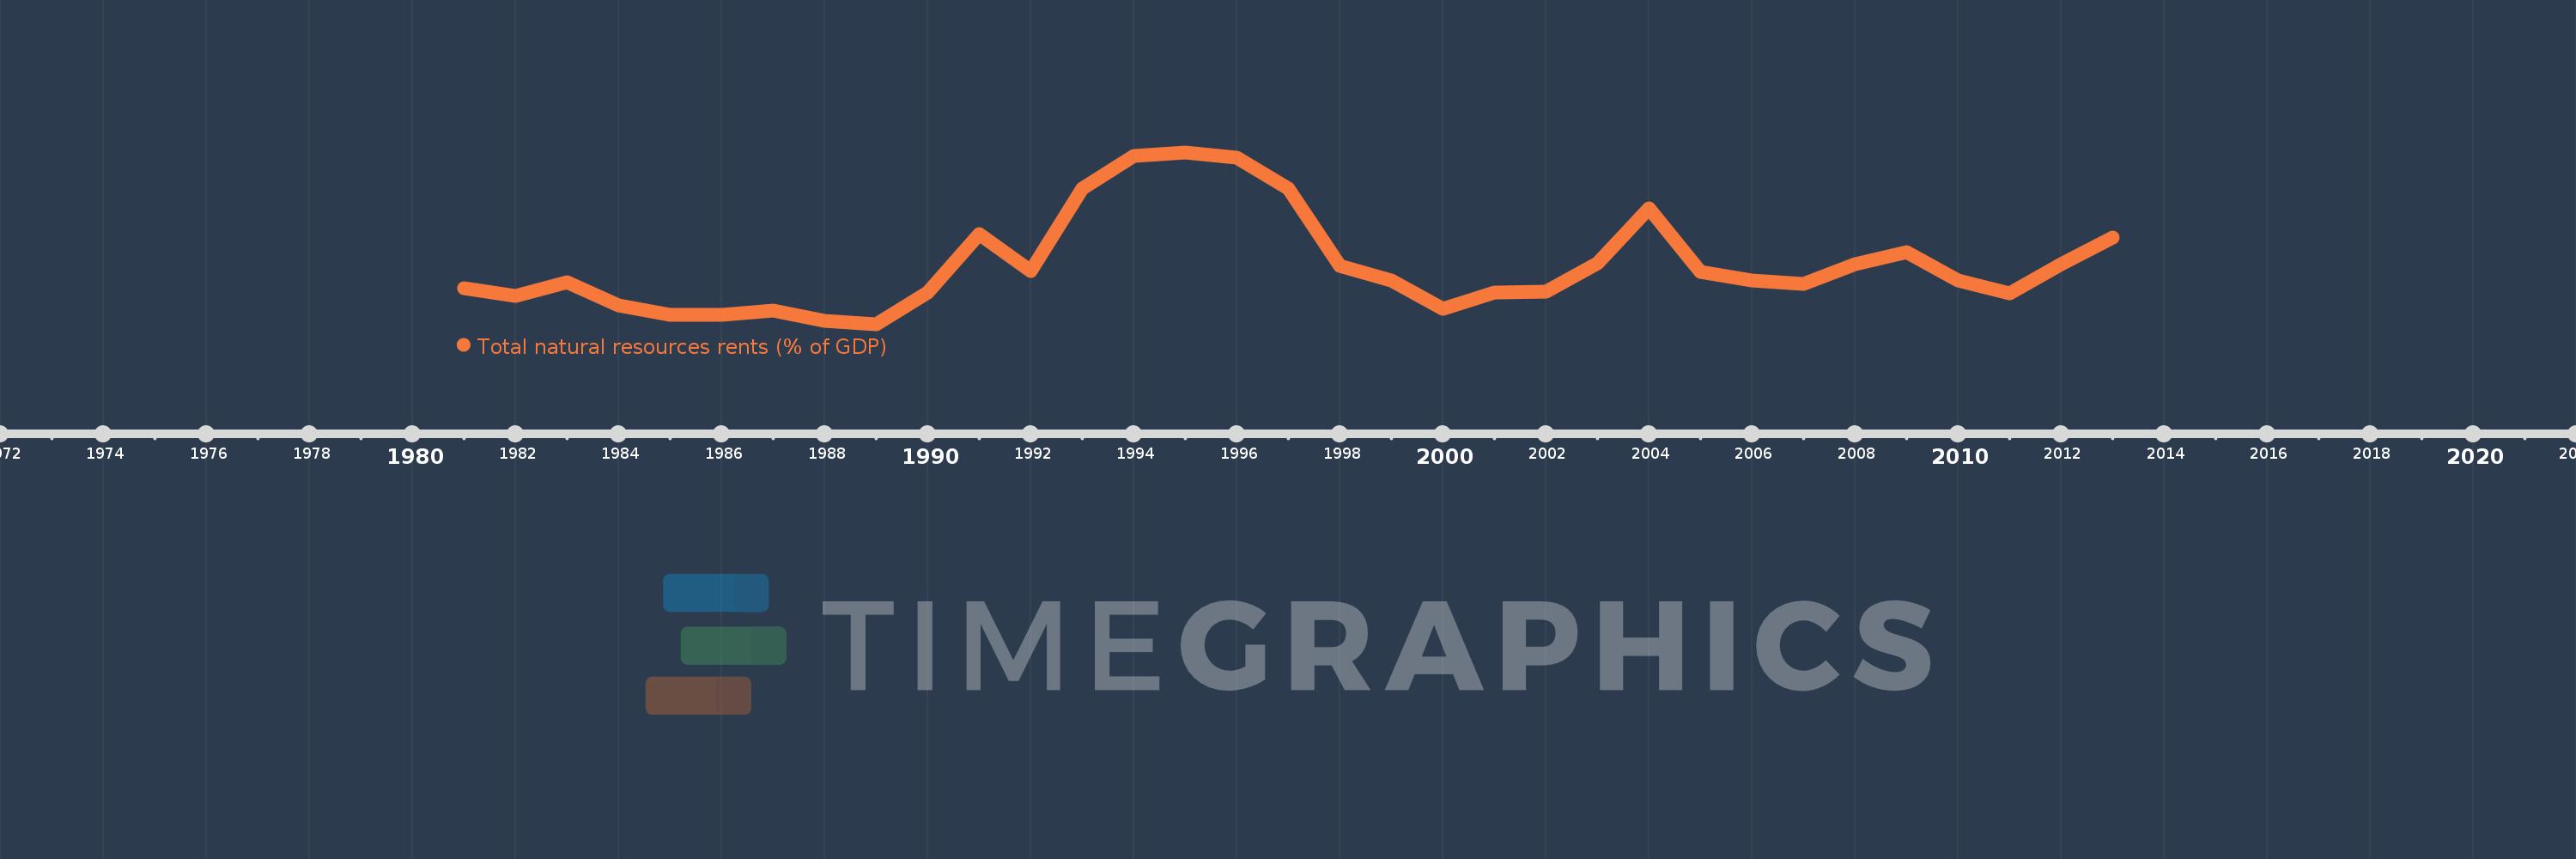
Total natural resources rents (% of GDP)
2013,2012,2011,2010,2009,2008,2007,2006,2005,2004,2003,2002,2001,2000,1999,1998,1997,1996,1995,1994,1993,1992,1991,1990,1989,1988,1987,1986,1985,1984,1983,1982,1981
This statistics in other country:
AfghanistanAlbaniaAlgeriaAngolaArab WorldArgentinaArmeniaArubaAustraliaAustriaAzerbaijanBahamas, TheBahrainBangladeshBarbadosBelarusBelgiumBelizeBeninBhutanBoliviaBosnia and HerzegovinaBotswanaBrazilBrunei DarussalamBulgariaBurkina FasoBurundiCabo VerdeCambodiaCameroonCanadaCaribbean small statesCentral African RepublicCentral Europe and the BalticsChadChileChinaColombiaComorosCongo, Dem. Rep.Congo, Rep.Costa RicaCote d'IvoireCroatiaCubaCyprusCzech RepublicDenmarkDjiboutiDominicaDominican RepublicEarly-demographic dividendEast Asia & PacificEast Asia & Pacific (excluding high income)East Asia & Pacific (IDA & IBRD countries)EcuadorEgypt, Arab Rep.El SalvadorEquatorial GuineaEritreaEstoniaEthiopiaEuro areaEurope & Central AsiaEurope & Central Asia (excluding high income)Europe & Central Asia (IDA & IBRD countries)European UnionFijiFinlandFragile and conflict affected situationsFranceFrench PolynesiaGabonGambia, TheGeorgiaGermanyGhanaGreeceGuatemalaGuineaGuinea-BissauGuyanaHaitiHeavily indebted poor countries (HIPC)High incomeHondurasHong Kong SAR, ChinaHungaryIBRD onlyIcelandIDA & IBRD totalIDA blendIDA onlyIDA totalIndiaIndonesiaIran, Islamic Rep.IraqIrelandIsraelItalyJamaicaJapanJordanKazakhstanKenyaKiribatiKorea, Rep.KuwaitKyrgyz RepublicLao PDRLate-demographic dividendLatin America & Caribbean Latin America & Caribbean (excluding high income)Latin America & the Caribbean (IDA & IBRD countries)LatviaLeast developed countries: UN classificationLebanonLesothoLiberiaLibyaLithuaniaLow & middle incomeLow incomeLower middle incomeLuxembourgMacao SAR, ChinaMacedonia, FYRMadagascarMalawiMalaysiaMaldivesMaliMaltaMauritaniaMauritiusMexicoMiddle East & North AfricaMiddle East & North Africa (excluding high income)Middle East & North Africa (IDA & IBRD countries)Middle incomeMoldovaMongoliaMontenegroMoroccoMozambiqueMyanmarNamibiaNepalNetherlandsNew CaledoniaNew ZealandNicaraguaNigerNigeriaNorth AmericaNorwayOECD membersOmanOther small statesPacific island small statesPakistanPanamaPapua New GuineaParaguayPeruPhilippinesPolandPortugalPost-demographic dividendPre-demographic dividendQatarRomaniaRussian FederationRwandaSamoaSao Tome and PrincipeSaudi ArabiaSenegalSerbiaSeychellesSierra LeoneSingaporeSlovak RepublicSloveniaSmall statesSolomon IslandsSouth AfricaSouth AsiaSouth Asia (IDA & IBRD)South SudanSpainSri LankaSt. LuciaSt. Vincent and the GrenadinesSub-Saharan Africa Sub-Saharan Africa (excluding high income)Sub-Saharan Africa (IDA & IBRD countries)SudanSurinameSwazilandSwedenSwitzerlandSyrian Arab RepublicTajikistanTanzaniaThailandTimor-LesteTogoTongaTrinidad and TobagoTunisiaTurkeyTurkmenistanUgandaUkraineUnited Arab EmiratesUnited KingdomUnited StatesUpper middle incomeUruguayUzbekistanVanuatuVenezuela, RBVietnamWorldYemen, Rep.ZambiaZimbabwe Timeline:
This timeline shows a graph from 1981 to 2013 of Liberia. No data until 1980. Number of actual observations by date: 33.
Source name:
World Development Indicators
Source organization:
Estimates based on sources and methods described in "The Changing Wealth of Nations: Measuring Sustainable Development in the New Millennium" (World Bank, 2011).
Categories, topics:
Energy & Mining, Environment
Last updated:
apr 23, 2017
Indicators value changes by year
Minimum:
17.562
jan 1, 1989
Maximum:
82.589
jan 1, 1995
At the date of observation
Value
Absolute change
Change from previous value
jan 1, 1981
31.028
+31.028
0.0%
jan 1, 1982
28.253
-2.775
-8.94%
jan 1, 1983
33.512
+5.259
18.61%
jan 1, 1984
24.7
-8.811
-26.29%
jan 1, 1985
21.048
-3.653
-14.79%
jan 1, 1986
21.227
+0.18
0.85%
jan 1, 1987
22.804
+1.576
7.43%
jan 1, 1988
18.756
-4.047
-17.75%
jan 1, 1989
17.562
-1.194
-6.37%
jan 1, 1990
29.609
+12.047
68.6%
jan 1, 1991
51.564
+21.956
74.15%
jan 1, 1992
37.692
-13.873
-26.9%
jan 1, 1993
68.912
+31.221
82.83%
jan 1, 1994
81.352
+12.44
18.05%
jan 1, 1995
82.589
+1.237
1.52%
jan 1, 1996
80.632
-1.958
-2.37%
jan 1, 1997
68.815
-11.817
-14.66%
jan 1, 1998
39.685
-29.13
-42.33%
jan 1, 1999
34.27
-5.415
-13.65%
jan 1, 2000
23.459
-10.811
-31.55%
jan 1, 2001
29.439
+5.98
25.49%
jan 1, 2002
29.755
+0.317
1.08%
jan 1, 2003
40.467
+10.711
36.0%
jan 1, 2004
61.514
+21.047
52.01%
jan 1, 2005
37.444
-24.07
-39.13%
jan 1, 2006
34.213
-3.231
-8.63%
jan 1, 2007
32.69
-1.523
-4.45%
jan 1, 2008
40.223
+7.533
23.04%
jan 1, 2009
44.74
+4.517
11.23%
jan 1, 2010
34.25
-10.489
-23.45%
jan 1, 2011
29.147
-5.103
-14.9%
jan 1, 2012
40.394
+11.246
38.58%
jan 1, 2013
50.387
+9.994
24.74%
Ranking of countries by current statistics by years


Comments: