29
/
en
AIzaSyAYiBZKx7MnpbEhh9jyipgxe19OcubqV5w
April 1, 2024
41136
Late-demographic dividend
LTE
false
2
1
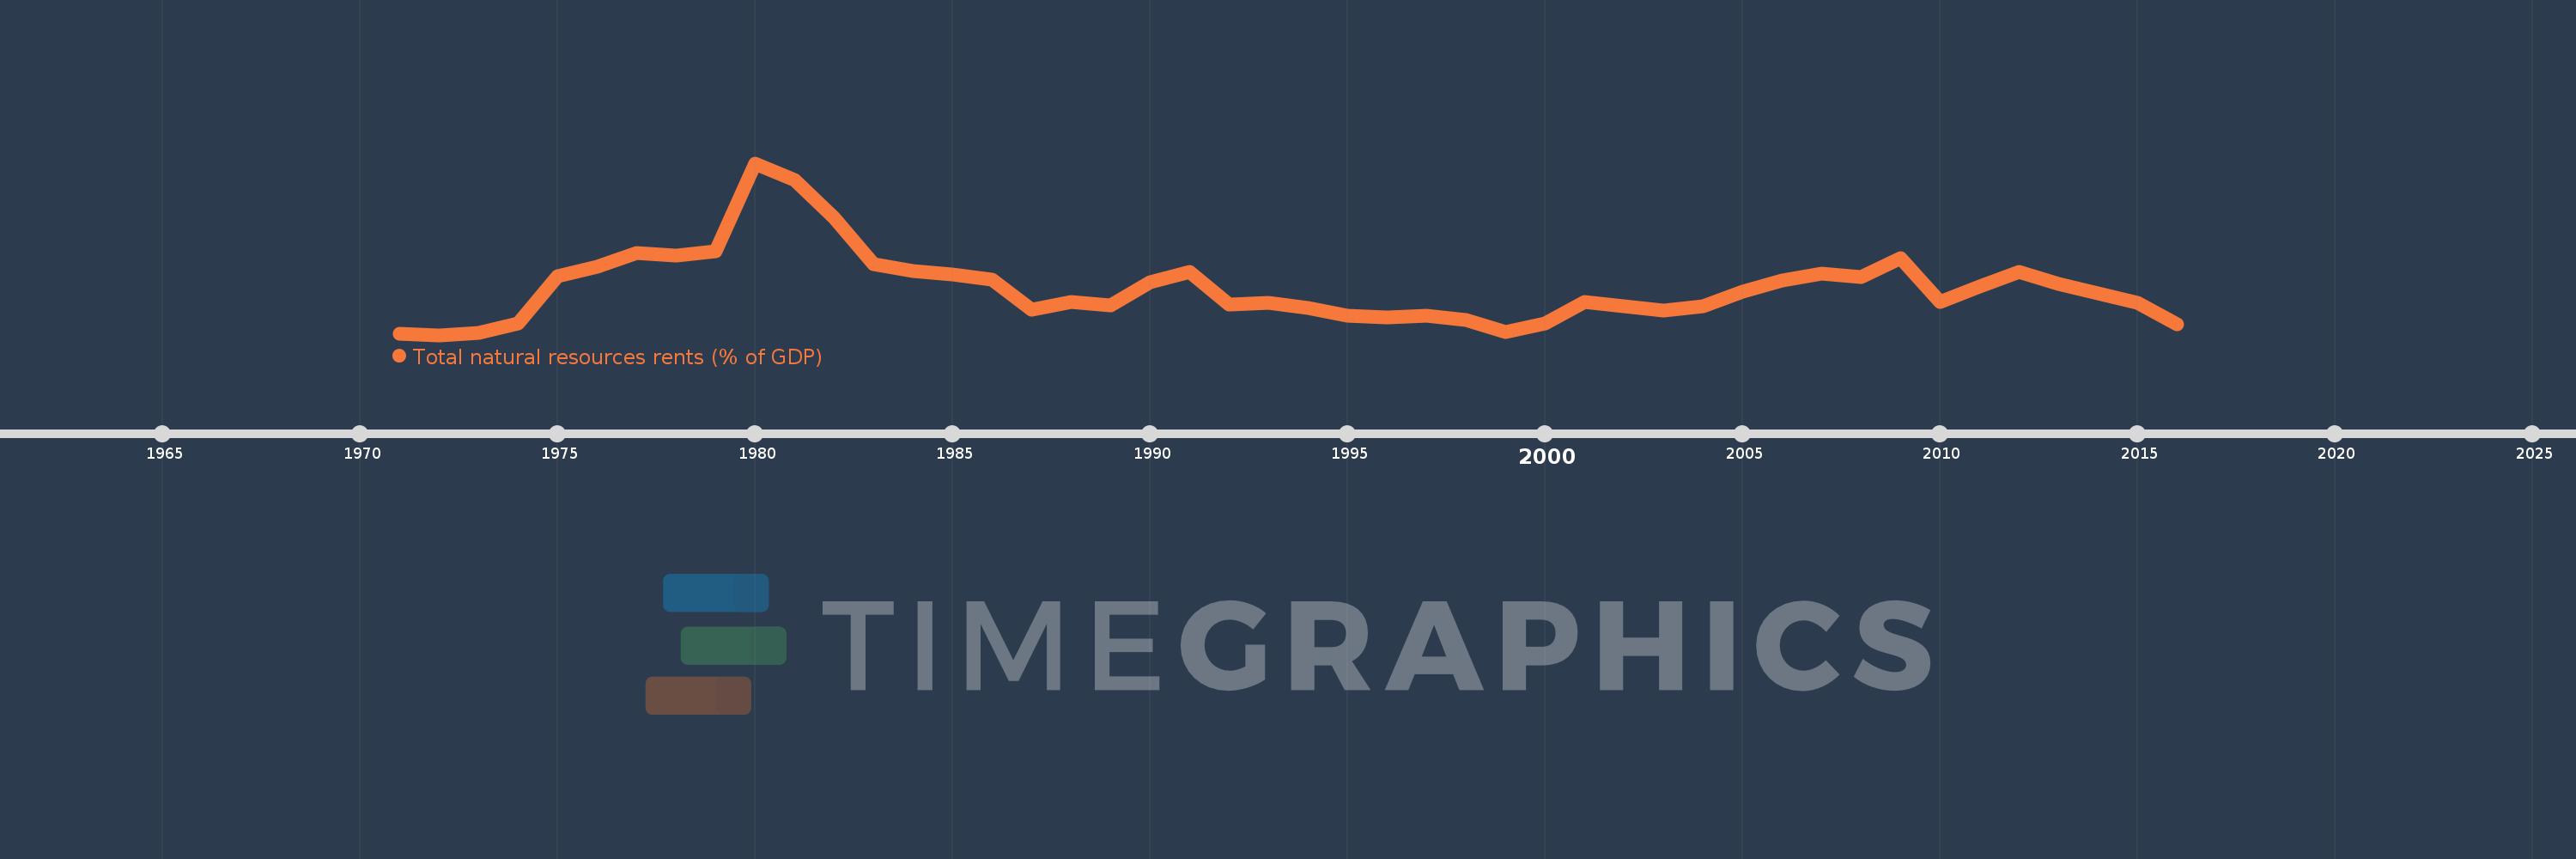
Total natural resources rents (% of GDP)
2016,2015,2014,2013,2012,2011,2010,2009,2008,2007,2006,2005,2004,2003,2002,2001,2000,1999,1998,1997,1996,1995,1994,1993,1992,1991,1990,1989,1988,1987,1986,1985,1984,1983,1982,1981,1980,1979,1978,1977,1976,1975,1974,1973,1972,1971
This statistics in other country:
AfghanistanAlbaniaAlgeriaAngolaArab WorldArgentinaArmeniaArubaAustraliaAustriaAzerbaijanBahamas, TheBahrainBangladeshBarbadosBelarusBelgiumBelizeBeninBhutanBoliviaBosnia and HerzegovinaBotswanaBrazilBrunei DarussalamBulgariaBurkina FasoBurundiCabo VerdeCambodiaCameroonCanadaCaribbean small statesCentral African RepublicCentral Europe and the BalticsChadChileChinaColombiaComorosCongo, Dem. Rep.Congo, Rep.Costa RicaCote d'IvoireCroatiaCubaCyprusCzech RepublicDenmarkDjiboutiDominicaDominican RepublicEarly-demographic dividendEast Asia & PacificEast Asia & Pacific (excluding high income)East Asia & Pacific (IDA & IBRD countries)EcuadorEgypt, Arab Rep.El SalvadorEquatorial GuineaEritreaEstoniaEthiopiaEuro areaEurope & Central AsiaEurope & Central Asia (excluding high income)Europe & Central Asia (IDA & IBRD countries)European UnionFijiFinlandFragile and conflict affected situationsFranceFrench PolynesiaGabonGambia, TheGeorgiaGermanyGhanaGreeceGuatemalaGuineaGuinea-BissauGuyanaHaitiHeavily indebted poor countries (HIPC)High incomeHondurasHong Kong SAR, ChinaHungaryIBRD onlyIcelandIDA & IBRD totalIDA blendIDA onlyIDA totalIndiaIndonesiaIran, Islamic Rep.IraqIrelandIsraelItalyJamaicaJapanJordanKazakhstanKenyaKiribatiKorea, Rep.KuwaitKyrgyz RepublicLao PDRLate-demographic dividendLatin America & Caribbean Latin America & Caribbean (excluding high income)Latin America & the Caribbean (IDA & IBRD countries)LatviaLeast developed countries: UN classificationLebanonLesothoLiberiaLibyaLithuaniaLow & middle incomeLow incomeLower middle incomeLuxembourgMacao SAR, ChinaMacedonia, FYRMadagascarMalawiMalaysiaMaldivesMaliMaltaMauritaniaMauritiusMexicoMiddle East & North AfricaMiddle East & North Africa (excluding high income)Middle East & North Africa (IDA & IBRD countries)Middle incomeMoldovaMongoliaMontenegroMoroccoMozambiqueMyanmarNamibiaNepalNetherlandsNew CaledoniaNew ZealandNicaraguaNigerNigeriaNorth AmericaNorwayOECD membersOmanOther small statesPacific island small statesPakistanPanamaPapua New GuineaParaguayPeruPhilippinesPolandPortugalPost-demographic dividendPre-demographic dividendQatarRomaniaRussian FederationRwandaSamoaSao Tome and PrincipeSaudi ArabiaSenegalSerbiaSeychellesSierra LeoneSingaporeSlovak RepublicSloveniaSmall statesSolomon IslandsSouth AfricaSouth AsiaSouth Asia (IDA & IBRD)South SudanSpainSri LankaSt. LuciaSt. Vincent and the GrenadinesSub-Saharan Africa Sub-Saharan Africa (excluding high income)Sub-Saharan Africa (IDA & IBRD countries)SudanSurinameSwazilandSwedenSwitzerlandSyrian Arab RepublicTajikistanTanzaniaThailandTimor-LesteTogoTongaTrinidad and TobagoTunisiaTurkeyTurkmenistanUgandaUkraineUnited Arab EmiratesUnited KingdomUnited StatesUpper middle incomeUruguayUzbekistanVanuatuVenezuela, RBVietnamWorldYemen, Rep.ZambiaZimbabwe Timeline:
This timeline shows a graph from 1971 to 2016 of Late-demographic dividend. No data until 1970. Number of actual observations by date: 46.
Source name:
World Development Indicators
Source organization:
Estimates based on sources and methods described in "The Changing Wealth of Nations: Measuring Sustainable Development in the New Millennium" (World Bank, 2011).
Categories, topics:
Energy & Mining, Environment
Last updated:
apr 23, 2017
Indicators value changes by year
Maximum:
22.484
jan 1, 1980
At the date of observation
Value
Absolute change
Change from previous value
jan 1, 1971
1.952
+1.952
0.0%
jan 1, 1972
1.799
-0.153
-7.85%
jan 1, 1973
2.058
+0.259
14.4%
jan 1, 1974
3.235
+1.177
57.18%
jan 1, 1975
8.859
+5.624
173.87%
jan 1, 1976
10.067
+1.208
13.64%
jan 1, 1977
11.711
+1.644
16.33%
jan 1, 1978
11.403
-0.308
-2.63%
jan 1, 1979
11.835
+0.432
3.79%
jan 1, 1980
22.484
+10.649
89.98%
jan 1, 1981
20.466
-2.018
-8.97%
jan 1, 1982
15.868
-4.598
-22.47%
jan 1, 1983
10.354
-5.514
-34.75%
jan 1, 1984
9.511
-0.843
-8.14%
jan 1, 1985
9.052
-0.459
-4.83%
jan 1, 1986
8.437
-0.616
-6.8%
jan 1, 1987
4.803
-3.633
-43.07%
jan 1, 1988
5.8
+0.997
20.76%
jan 1, 1989
5.392
-0.409
-7.04%
jan 1, 1990
8.205
+2.813
52.18%
jan 1, 1991
9.424
+1.219
14.86%
jan 1, 1992
5.484
-3.94
-41.81%
jan 1, 1993
5.696
+0.212
3.87%
jan 1, 1994
5.099
-0.598
-10.49%
jan 1, 1995
4.083
-1.015
-19.91%
jan 1, 1996
3.872
-0.211
-5.17%
jan 1, 1997
4.144
+0.271
7.01%
jan 1, 1998
3.566
-0.577
-13.93%
jan 1, 1999
2.128
-1.439
-40.34%
jan 1, 2000
3.244
+1.117
52.48%
jan 1, 2001
5.753
+2.509
77.33%
jan 1, 2002
5.23
-0.523
-9.09%
jan 1, 2003
4.734
-0.496
-9.48%
jan 1, 2004
5.275
+0.541
11.43%
jan 1, 2005
6.982
+1.707
32.37%
jan 1, 2006
8.403
+1.421
20.35%
jan 1, 2007
9.205
+0.802
9.54%
jan 1, 2008
8.816
-0.389
-4.22%
jan 1, 2009
11.07
+2.254
25.57%
jan 1, 2010
5.828
-5.243
-47.36%
jan 1, 2011
7.645
+1.818
31.2%
jan 1, 2012
9.451
+1.806
23.62%
jan 1, 2013
7.914
-1.537
-16.27%
jan 1, 2014
6.857
-1.057
-13.36%
jan 1, 2015
5.72
-1.137
-16.58%
jan 1, 2016
3.096
-2.624
-45.88%
Ranking of countries by current statistics by years


Comments: