29
/
en
AIzaSyAYiBZKx7MnpbEhh9jyipgxe19OcubqV5w
April 1, 2024
84868
Benin
BEN
true
2
1
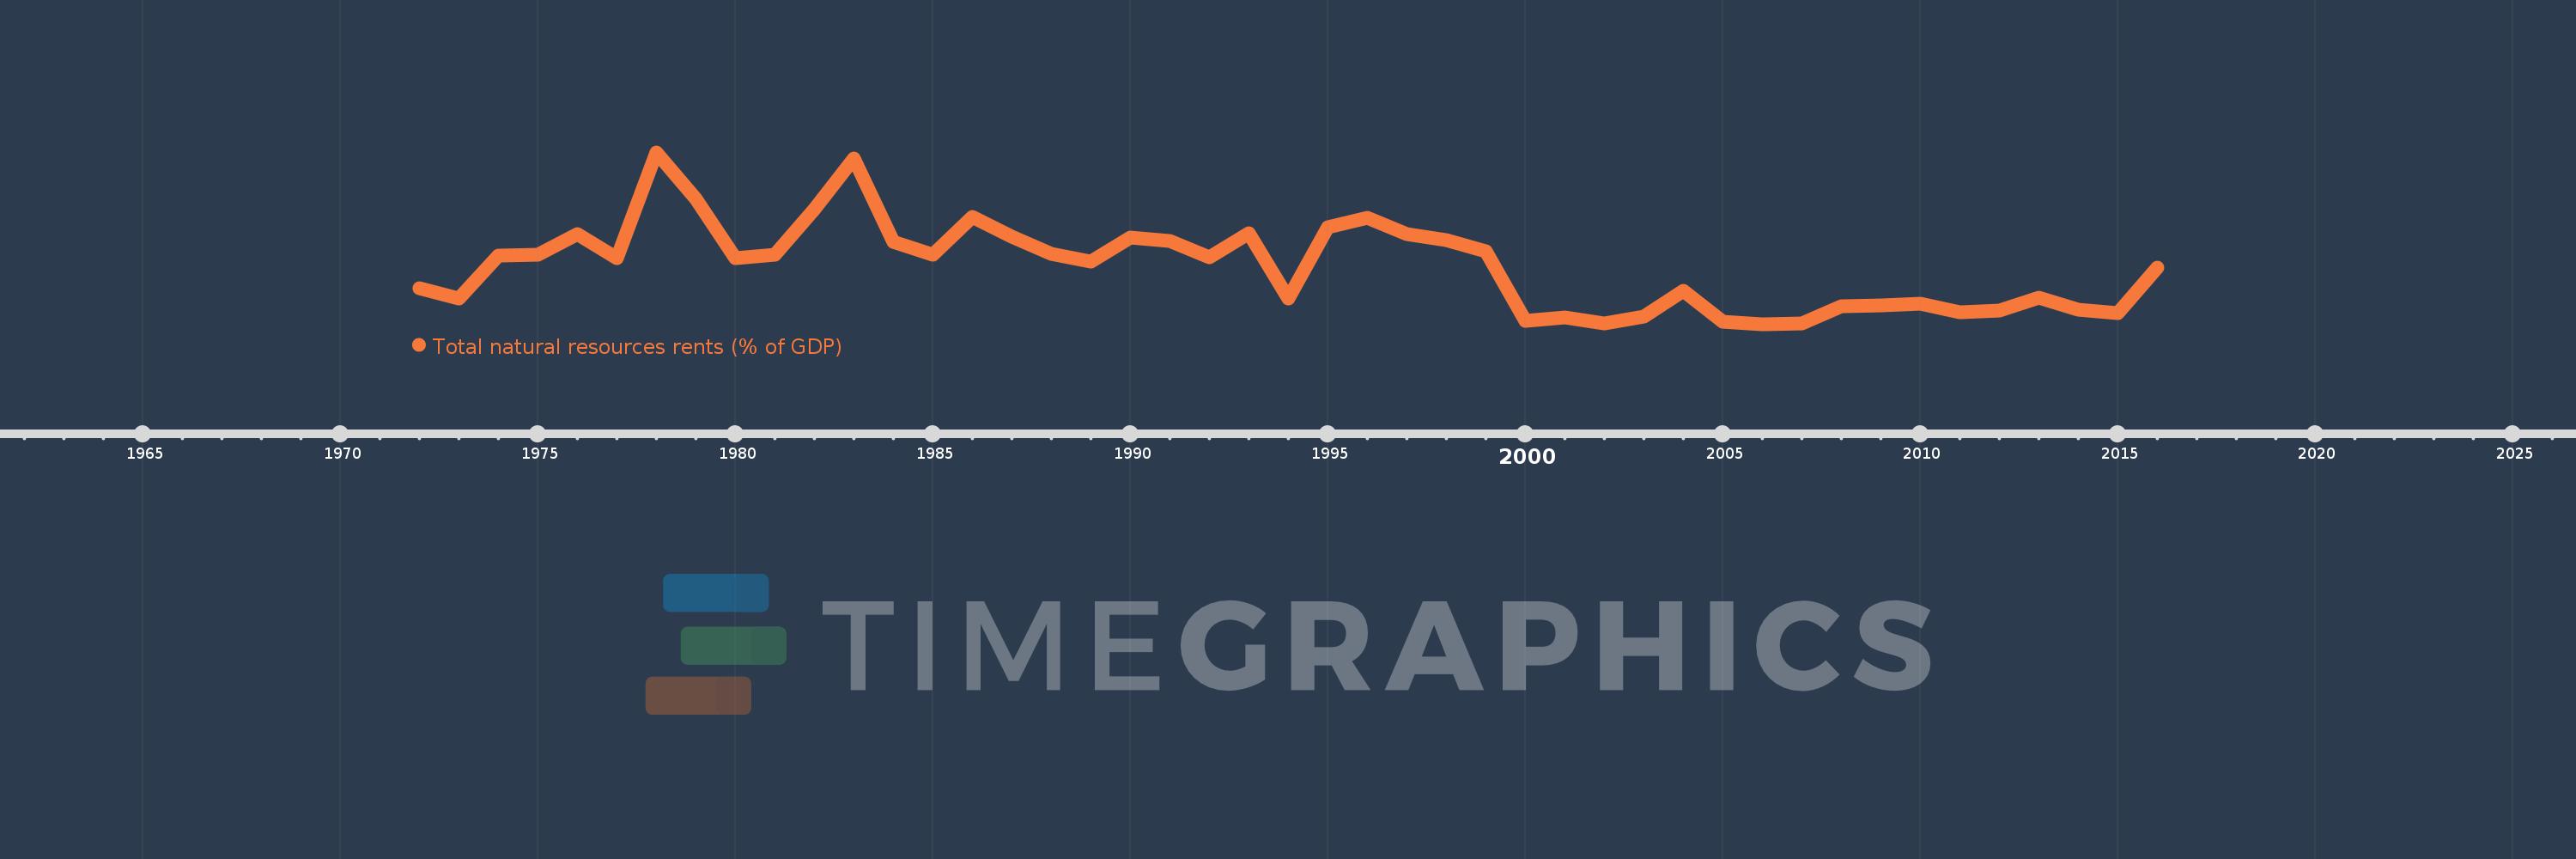
Total natural resources rents (% of GDP)
2016,2015,2014,2013,2012,2011,2010,2009,2008,2007,2006,2005,2004,2003,2002,2001,2000,1999,1998,1997,1996,1995,1994,1993,1992,1991,1990,1989,1988,1987,1986,1985,1984,1983,1982,1981,1980,1979,1978,1977,1976,1975,1974,1973,1972
This statistics in other country:
AfghanistanAlbaniaAlgeriaAngolaArab WorldArgentinaArmeniaArubaAustraliaAustriaAzerbaijanBahamas, TheBahrainBangladeshBarbadosBelarusBelgiumBelizeBeninBhutanBoliviaBosnia and HerzegovinaBotswanaBrazilBrunei DarussalamBulgariaBurkina FasoBurundiCabo VerdeCambodiaCameroonCanadaCaribbean small statesCentral African RepublicCentral Europe and the BalticsChadChileChinaColombiaComorosCongo, Dem. Rep.Congo, Rep.Costa RicaCote d'IvoireCroatiaCubaCyprusCzech RepublicDenmarkDjiboutiDominicaDominican RepublicEarly-demographic dividendEast Asia & PacificEast Asia & Pacific (excluding high income)East Asia & Pacific (IDA & IBRD countries)EcuadorEgypt, Arab Rep.El SalvadorEquatorial GuineaEritreaEstoniaEthiopiaEuro areaEurope & Central AsiaEurope & Central Asia (excluding high income)Europe & Central Asia (IDA & IBRD countries)European UnionFijiFinlandFragile and conflict affected situationsFranceFrench PolynesiaGabonGambia, TheGeorgiaGermanyGhanaGreeceGuatemalaGuineaGuinea-BissauGuyanaHaitiHeavily indebted poor countries (HIPC)High incomeHondurasHong Kong SAR, ChinaHungaryIBRD onlyIcelandIDA & IBRD totalIDA blendIDA onlyIDA totalIndiaIndonesiaIran, Islamic Rep.IraqIrelandIsraelItalyJamaicaJapanJordanKazakhstanKenyaKiribatiKorea, Rep.KuwaitKyrgyz RepublicLao PDRLate-demographic dividendLatin America & Caribbean Latin America & Caribbean (excluding high income)Latin America & the Caribbean (IDA & IBRD countries)LatviaLeast developed countries: UN classificationLebanonLesothoLiberiaLibyaLithuaniaLow & middle incomeLow incomeLower middle incomeLuxembourgMacao SAR, ChinaMacedonia, FYRMadagascarMalawiMalaysiaMaldivesMaliMaltaMauritaniaMauritiusMexicoMiddle East & North AfricaMiddle East & North Africa (excluding high income)Middle East & North Africa (IDA & IBRD countries)Middle incomeMoldovaMongoliaMontenegroMoroccoMozambiqueMyanmarNamibiaNepalNetherlandsNew CaledoniaNew ZealandNicaraguaNigerNigeriaNorth AmericaNorwayOECD membersOmanOther small statesPacific island small statesPakistanPanamaPapua New GuineaParaguayPeruPhilippinesPolandPortugalPost-demographic dividendPre-demographic dividendQatarRomaniaRussian FederationRwandaSamoaSao Tome and PrincipeSaudi ArabiaSenegalSerbiaSeychellesSierra LeoneSingaporeSlovak RepublicSloveniaSmall statesSolomon IslandsSouth AfricaSouth AsiaSouth Asia (IDA & IBRD)South SudanSpainSri LankaSt. LuciaSt. Vincent and the GrenadinesSub-Saharan Africa Sub-Saharan Africa (excluding high income)Sub-Saharan Africa (IDA & IBRD countries)SudanSurinameSwazilandSwedenSwitzerlandSyrian Arab RepublicTajikistanTanzaniaThailandTimor-LesteTogoTongaTrinidad and TobagoTunisiaTurkeyTurkmenistanUgandaUkraineUnited Arab EmiratesUnited KingdomUnited StatesUpper middle incomeUruguayUzbekistanVanuatuVenezuela, RBVietnamWorldYemen, Rep.ZambiaZimbabwe Timeline:
This timeline shows a graph from 1972 to 2016 of Benin. No data until 1971. Number of actual observations by date: 45.
Source name:
World Development Indicators
Source organization:
Estimates based on sources and methods described in "The Changing Wealth of Nations: Measuring Sustainable Development in the New Millennium" (World Bank, 2011).
Categories, topics:
Energy & Mining, Environment
Last updated:
apr 23, 2017
Indicators value changes by year
Maximum:
11.975
jan 1, 1978
At the date of observation
Value
Absolute change
Change from previous value
jan 1, 1972
5.793
+5.793
0.0%
jan 1, 1973
5.341
-0.452
-7.81%
jan 1, 1974
7.265
+1.925
36.04%
jan 1, 1975
7.301
+0.035
0.48%
jan 1, 1976
8.248
+0.948
12.98%
jan 1, 1977
7.171
-1.077
-13.06%
jan 1, 1978
11.975
+4.805
67.01%
jan 1, 1979
9.875
-2.1
-17.54%
jan 1, 1980
7.167
-2.708
-27.42%
jan 1, 1981
7.312
+0.144
2.01%
jan 1, 1982
9.378
+2.066
28.26%
jan 1, 1983
11.699
+2.321
24.75%
jan 1, 1984
7.92
-3.779
-32.3%
jan 1, 1985
7.31
-0.61
-7.7%
jan 1, 1986
9.037
+1.727
23.63%
jan 1, 1987
8.125
-0.912
-10.09%
jan 1, 1988
7.365
-0.76
-9.36%
jan 1, 1989
6.998
-0.367
-4.98%
jan 1, 1990
8.098
+1.099
15.71%
jan 1, 1991
7.944
-0.153
-1.89%
jan 1, 1992
7.183
-0.762
-9.59%
jan 1, 1993
8.302
+1.119
15.58%
jan 1, 1994
5.319
-2.983
-35.93%
jan 1, 1995
8.583
+3.264
61.36%
jan 1, 1996
9.002
+0.419
4.88%
jan 1, 1997
8.247
-0.755
-8.39%
jan 1, 1998
7.963
-0.284
-3.44%
jan 1, 1999
7.481
-0.482
-6.05%
jan 1, 2000
4.302
-3.179
-42.49%
jan 1, 2001
4.466
+0.164
3.82%
jan 1, 2002
4.205
-0.261
-5.84%
jan 1, 2003
4.52
+0.315
7.49%
jan 1, 2004
5.674
+1.154
25.53%
jan 1, 2005
4.282
-1.392
-24.53%
jan 1, 2006
4.153
-0.13
-3.03%
jan 1, 2007
4.171
+0.018
0.43%
jan 1, 2008
4.957
+0.787
18.86%
jan 1, 2009
5.01
+0.053
1.07%
jan 1, 2010
5.086
+0.076
1.52%
jan 1, 2011
4.687
-0.399
-7.85%
jan 1, 2012
4.766
+0.079
1.68%
jan 1, 2013
5.351
+0.585
12.28%
jan 1, 2014
4.805
-0.546
-10.2%
jan 1, 2015
4.645
-0.16
-3.34%
jan 1, 2016
6.727
+2.082
44.82%
Ranking of countries by current statistics by years


Comments: