29
/
en
AIzaSyAYiBZKx7MnpbEhh9jyipgxe19OcubqV5w
April 1, 2024
90620
Botswana
BWA
true
2
1
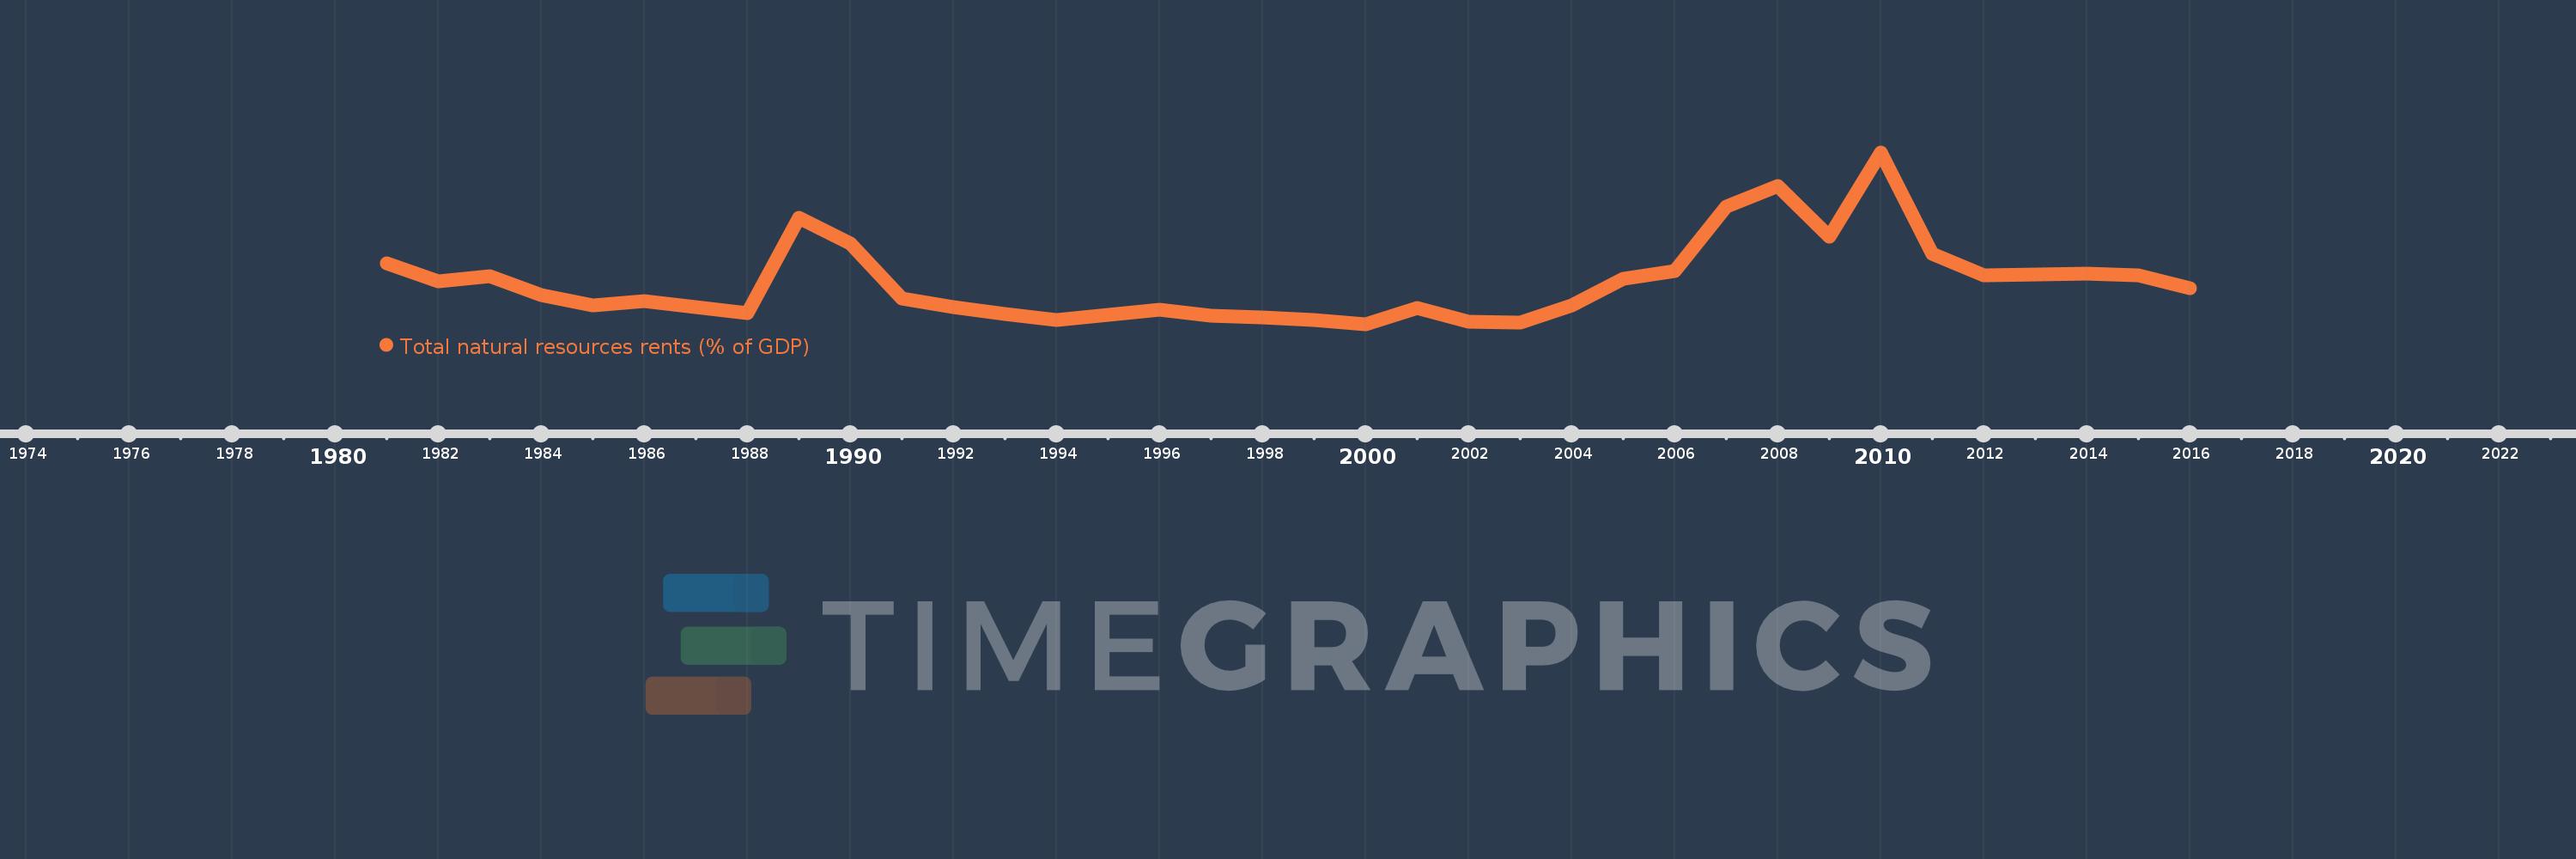
Total natural resources rents (% of GDP)
2016,2015,2014,2013,2012,2011,2010,2009,2008,2007,2006,2005,2004,2003,2002,2001,2000,1999,1998,1997,1996,1995,1994,1993,1992,1991,1990,1989,1988,1987,1986,1985,1984,1983,1982,1981
This statistics in other country:
AfghanistanAlbaniaAlgeriaAngolaArab WorldArgentinaArmeniaArubaAustraliaAustriaAzerbaijanBahamas, TheBahrainBangladeshBarbadosBelarusBelgiumBelizeBeninBhutanBoliviaBosnia and HerzegovinaBotswanaBrazilBrunei DarussalamBulgariaBurkina FasoBurundiCabo VerdeCambodiaCameroonCanadaCaribbean small statesCentral African RepublicCentral Europe and the BalticsChadChileChinaColombiaComorosCongo, Dem. Rep.Congo, Rep.Costa RicaCote d'IvoireCroatiaCubaCyprusCzech RepublicDenmarkDjiboutiDominicaDominican RepublicEarly-demographic dividendEast Asia & PacificEast Asia & Pacific (excluding high income)East Asia & Pacific (IDA & IBRD countries)EcuadorEgypt, Arab Rep.El SalvadorEquatorial GuineaEritreaEstoniaEthiopiaEuro areaEurope & Central AsiaEurope & Central Asia (excluding high income)Europe & Central Asia (IDA & IBRD countries)European UnionFijiFinlandFragile and conflict affected situationsFranceFrench PolynesiaGabonGambia, TheGeorgiaGermanyGhanaGreeceGuatemalaGuineaGuinea-BissauGuyanaHaitiHeavily indebted poor countries (HIPC)High incomeHondurasHong Kong SAR, ChinaHungaryIBRD onlyIcelandIDA & IBRD totalIDA blendIDA onlyIDA totalIndiaIndonesiaIran, Islamic Rep.IraqIrelandIsraelItalyJamaicaJapanJordanKazakhstanKenyaKiribatiKorea, Rep.KuwaitKyrgyz RepublicLao PDRLate-demographic dividendLatin America & Caribbean Latin America & Caribbean (excluding high income)Latin America & the Caribbean (IDA & IBRD countries)LatviaLeast developed countries: UN classificationLebanonLesothoLiberiaLibyaLithuaniaLow & middle incomeLow incomeLower middle incomeLuxembourgMacao SAR, ChinaMacedonia, FYRMadagascarMalawiMalaysiaMaldivesMaliMaltaMauritaniaMauritiusMexicoMiddle East & North AfricaMiddle East & North Africa (excluding high income)Middle East & North Africa (IDA & IBRD countries)Middle incomeMoldovaMongoliaMontenegroMoroccoMozambiqueMyanmarNamibiaNepalNetherlandsNew CaledoniaNew ZealandNicaraguaNigerNigeriaNorth AmericaNorwayOECD membersOmanOther small statesPacific island small statesPakistanPanamaPapua New GuineaParaguayPeruPhilippinesPolandPortugalPost-demographic dividendPre-demographic dividendQatarRomaniaRussian FederationRwandaSamoaSao Tome and PrincipeSaudi ArabiaSenegalSerbiaSeychellesSierra LeoneSingaporeSlovak RepublicSloveniaSmall statesSolomon IslandsSouth AfricaSouth AsiaSouth Asia (IDA & IBRD)South SudanSpainSri LankaSt. LuciaSt. Vincent and the GrenadinesSub-Saharan Africa Sub-Saharan Africa (excluding high income)Sub-Saharan Africa (IDA & IBRD countries)SudanSurinameSwazilandSwedenSwitzerlandSyrian Arab RepublicTajikistanTanzaniaThailandTimor-LesteTogoTongaTrinidad and TobagoTunisiaTurkeyTurkmenistanUgandaUkraineUnited Arab EmiratesUnited KingdomUnited StatesUpper middle incomeUruguayUzbekistanVanuatuVenezuela, RBVietnamWorldYemen, Rep.ZambiaZimbabwe Timeline:
This timeline shows a graph from 1981 to 2016 of Botswana. No data until 1980. Number of actual observations by date: 36.
Source name:
World Development Indicators
Source organization:
Estimates based on sources and methods described in "The Changing Wealth of Nations: Measuring Sustainable Development in the New Millennium" (World Bank, 2011).
Categories, topics:
Energy & Mining, Environment
Last updated:
apr 23, 2017
Indicators value changes by year
Maximum:
11.454
jan 1, 2010
At the date of observation
Value
Absolute change
Change from previous value
jan 1, 1981
4.331
+4.331
0.0%
jan 1, 1982
3.152
-1.178
-27.21%
jan 1, 1983
3.506
+0.354
11.23%
jan 1, 1984
2.313
-1.194
-34.04%
jan 1, 1985
1.653
-0.66
-28.52%
jan 1, 1986
1.896
+0.243
14.68%
jan 1, 1987
1.496
-0.4
-21.09%
jan 1, 1988
1.151
-0.345
-23.07%
jan 1, 1989
7.259
+6.108
530.8%
jan 1, 1990
5.577
-1.682
-23.17%
jan 1, 1991
2.057
-3.521
-63.12%
jan 1, 1992
1.506
-0.551
-26.77%
jan 1, 1993
1.048
-0.459
-30.44%
jan 1, 1994
0.704
-0.343
-32.76%
jan 1, 1995
0.997
+0.293
41.53%
jan 1, 1996
1.325
+0.328
32.92%
jan 1, 1997
0.97
-0.355
-26.79%
jan 1, 1998
0.871
-0.099
-10.18%
jan 1, 1999
0.665
-0.207
-23.73%
jan 1, 2000
0.419
-0.246
-36.95%
jan 1, 2001
1.445
+1.026
244.77%
jan 1, 2002
0.575
-0.87
-60.19%
jan 1, 2003
0.548
-0.027
-4.76%
jan 1, 2004
1.62
+1.072
195.72%
jan 1, 2005
3.315
+1.696
104.69%
jan 1, 2006
3.823
+0.508
15.31%
jan 1, 2007
7.987
+4.164
108.93%
jan 1, 2008
9.272
+1.285
16.09%
jan 1, 2009
6.042
-3.23
-34.84%
jan 1, 2010
11.454
+5.412
89.57%
jan 1, 2011
4.936
-6.517
-56.9%
jan 1, 2012
3.569
-1.368
-27.71%
jan 1, 2013
3.629
+0.06
1.69%
jan 1, 2014
3.684
+0.055
1.52%
jan 1, 2015
3.58
-0.104
-2.84%
jan 1, 2016
2.712
-0.868
-24.25%
Ranking of countries by current statistics by years


Comments: