29
/
en
AIzaSyAYiBZKx7MnpbEhh9jyipgxe19OcubqV5w
April 1, 2024
202392
Morocco
MAR
true
2
1
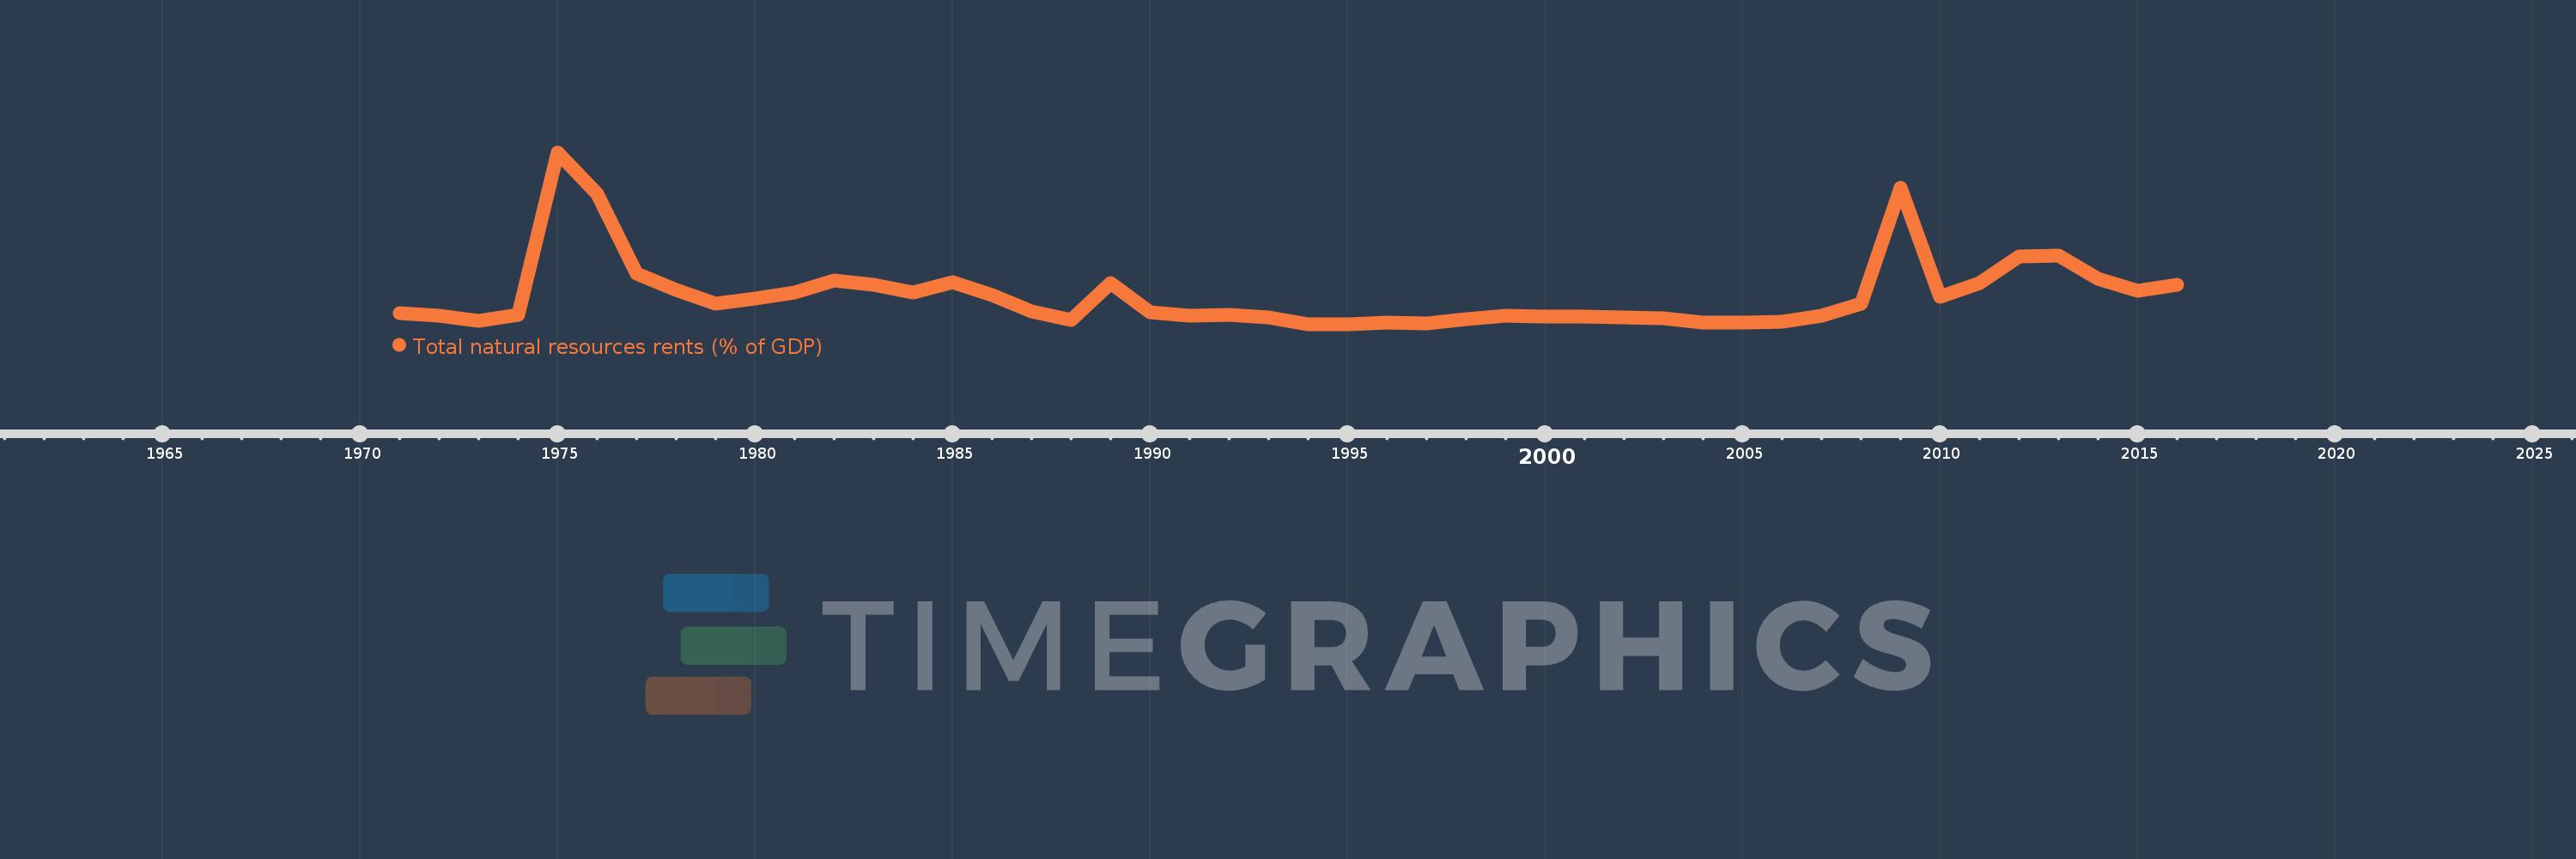
Total natural resources rents (% of GDP)
2016,2015,2014,2013,2012,2011,2010,2009,2008,2007,2006,2005,2004,2003,2002,2001,2000,1999,1998,1997,1996,1995,1994,1993,1992,1991,1990,1989,1988,1987,1986,1985,1984,1983,1982,1981,1980,1979,1978,1977,1976,1975,1974,1973,1972,1971
This statistics in other country:
AfghanistanAlbaniaAlgeriaAngolaArab WorldArgentinaArmeniaArubaAustraliaAustriaAzerbaijanBahamas, TheBahrainBangladeshBarbadosBelarusBelgiumBelizeBeninBhutanBoliviaBosnia and HerzegovinaBotswanaBrazilBrunei DarussalamBulgariaBurkina FasoBurundiCabo VerdeCambodiaCameroonCanadaCaribbean small statesCentral African RepublicCentral Europe and the BalticsChadChileChinaColombiaComorosCongo, Dem. Rep.Congo, Rep.Costa RicaCote d'IvoireCroatiaCubaCyprusCzech RepublicDenmarkDjiboutiDominicaDominican RepublicEarly-demographic dividendEast Asia & PacificEast Asia & Pacific (excluding high income)East Asia & Pacific (IDA & IBRD countries)EcuadorEgypt, Arab Rep.El SalvadorEquatorial GuineaEritreaEstoniaEthiopiaEuro areaEurope & Central AsiaEurope & Central Asia (excluding high income)Europe & Central Asia (IDA & IBRD countries)European UnionFijiFinlandFragile and conflict affected situationsFranceFrench PolynesiaGabonGambia, TheGeorgiaGermanyGhanaGreeceGuatemalaGuineaGuinea-BissauGuyanaHaitiHeavily indebted poor countries (HIPC)High incomeHondurasHong Kong SAR, ChinaHungaryIBRD onlyIcelandIDA & IBRD totalIDA blendIDA onlyIDA totalIndiaIndonesiaIran, Islamic Rep.IraqIrelandIsraelItalyJamaicaJapanJordanKazakhstanKenyaKiribatiKorea, Rep.KuwaitKyrgyz RepublicLao PDRLate-demographic dividendLatin America & Caribbean Latin America & Caribbean (excluding high income)Latin America & the Caribbean (IDA & IBRD countries)LatviaLeast developed countries: UN classificationLebanonLesothoLiberiaLibyaLithuaniaLow & middle incomeLow incomeLower middle incomeLuxembourgMacao SAR, ChinaMacedonia, FYRMadagascarMalawiMalaysiaMaldivesMaliMaltaMauritaniaMauritiusMexicoMiddle East & North AfricaMiddle East & North Africa (excluding high income)Middle East & North Africa (IDA & IBRD countries)Middle incomeMoldovaMongoliaMontenegroMoroccoMozambiqueMyanmarNamibiaNepalNetherlandsNew CaledoniaNew ZealandNicaraguaNigerNigeriaNorth AmericaNorwayOECD membersOmanOther small statesPacific island small statesPakistanPanamaPapua New GuineaParaguayPeruPhilippinesPolandPortugalPost-demographic dividendPre-demographic dividendQatarRomaniaRussian FederationRwandaSamoaSao Tome and PrincipeSaudi ArabiaSenegalSerbiaSeychellesSierra LeoneSingaporeSlovak RepublicSloveniaSmall statesSolomon IslandsSouth AfricaSouth AsiaSouth Asia (IDA & IBRD)South SudanSpainSri LankaSt. LuciaSt. Vincent and the GrenadinesSub-Saharan Africa Sub-Saharan Africa (excluding high income)Sub-Saharan Africa (IDA & IBRD countries)SudanSurinameSwazilandSwedenSwitzerlandSyrian Arab RepublicTajikistanTanzaniaThailandTimor-LesteTogoTongaTrinidad and TobagoTunisiaTurkeyTurkmenistanUgandaUkraineUnited Arab EmiratesUnited KingdomUnited StatesUpper middle incomeUruguayUzbekistanVanuatuVenezuela, RBVietnamWorldYemen, Rep.ZambiaZimbabwe Timeline:
This timeline shows a graph from 1971 to 2016 of Morocco. No data until 1970. Number of actual observations by date: 46.
Source name:
World Development Indicators
Source organization:
Estimates based on sources and methods described in "The Changing Wealth of Nations: Measuring Sustainable Development in the New Millennium" (World Bank, 2011).
Categories, topics:
Energy & Mining, Environment
Last updated:
apr 23, 2017
Indicators value changes by year
Maximum:
10.456
jan 1, 1975
At the date of observation
Value
Absolute change
Change from previous value
jan 1, 1971
0.903
+0.903
0.0%
jan 1, 1972
0.744
-0.159
-17.6%
jan 1, 1973
0.45
-0.294
-39.48%
jan 1, 1974
0.806
+0.355
78.91%
jan 1, 1975
10.456
+9.651
1.2K%
jan 1, 1976
8.007
-2.449
-23.43%
jan 1, 1977
3.264
-4.743
-59.24%
jan 1, 1978
2.308
-0.956
-29.29%
jan 1, 1979
1.452
-0.856
-37.08%
jan 1, 1980
1.782
+0.33
22.74%
jan 1, 1981
2.127
+0.345
19.36%
jan 1, 1982
2.848
+0.72
33.86%
jan 1, 1983
2.575
-0.273
-9.57%
jan 1, 1984
2.14
-0.435
-16.9%
jan 1, 1985
2.764
+0.624
29.14%
jan 1, 1986
2.001
-0.763
-27.6%
jan 1, 1987
1.034
-0.967
-48.32%
jan 1, 1988
0.523
-0.511
-49.4%
jan 1, 1989
2.693
+2.17
414.74%
jan 1, 1990
0.952
-1.741
-64.65%
jan 1, 1991
0.749
-0.203
-21.31%
jan 1, 1992
0.815
+0.066
8.78%
jan 1, 1993
0.662
-0.153
-18.82%
jan 1, 1994
0.263
-0.399
-60.28%
jan 1, 1995
0.249
-0.013
-5.06%
jan 1, 1996
0.345
+0.096
38.43%
jan 1, 1997
0.306
-0.039
-11.32%
jan 1, 1998
0.553
+0.246
80.43%
jan 1, 1999
0.773
+0.221
39.96%
jan 1, 2000
0.692
-0.082
-10.56%
jan 1, 2001
0.706
+0.015
2.15%
jan 1, 2002
0.672
-0.034
-4.87%
jan 1, 2003
0.598
-0.074
-11.03%
jan 1, 2004
0.358
-0.24
-40.14%
jan 1, 2005
0.352
-0.006
-1.69%
jan 1, 2006
0.403
+0.051
14.44%
jan 1, 2007
0.742
+0.339
84.2%
jan 1, 2008
1.468
+0.726
97.82%
jan 1, 2009
8.336
+6.869
468.03%
jan 1, 2010
1.882
-6.455
-77.43%
jan 1, 2011
2.711
+0.829
44.08%
jan 1, 2012
4.301
+1.59
58.66%
jan 1, 2013
4.323
+0.021
0.5%
jan 1, 2014
2.93
-1.393
-32.22%
jan 1, 2015
2.224
-0.706
-24.11%
jan 1, 2016
2.566
+0.342
15.39%
Ranking of countries by current statistics by years


Comments: