29
/
en
AIzaSyAYiBZKx7MnpbEhh9jyipgxe19OcubqV5w
April 1, 2024
27767
East Asia & Pacific
EAS
false
2
1
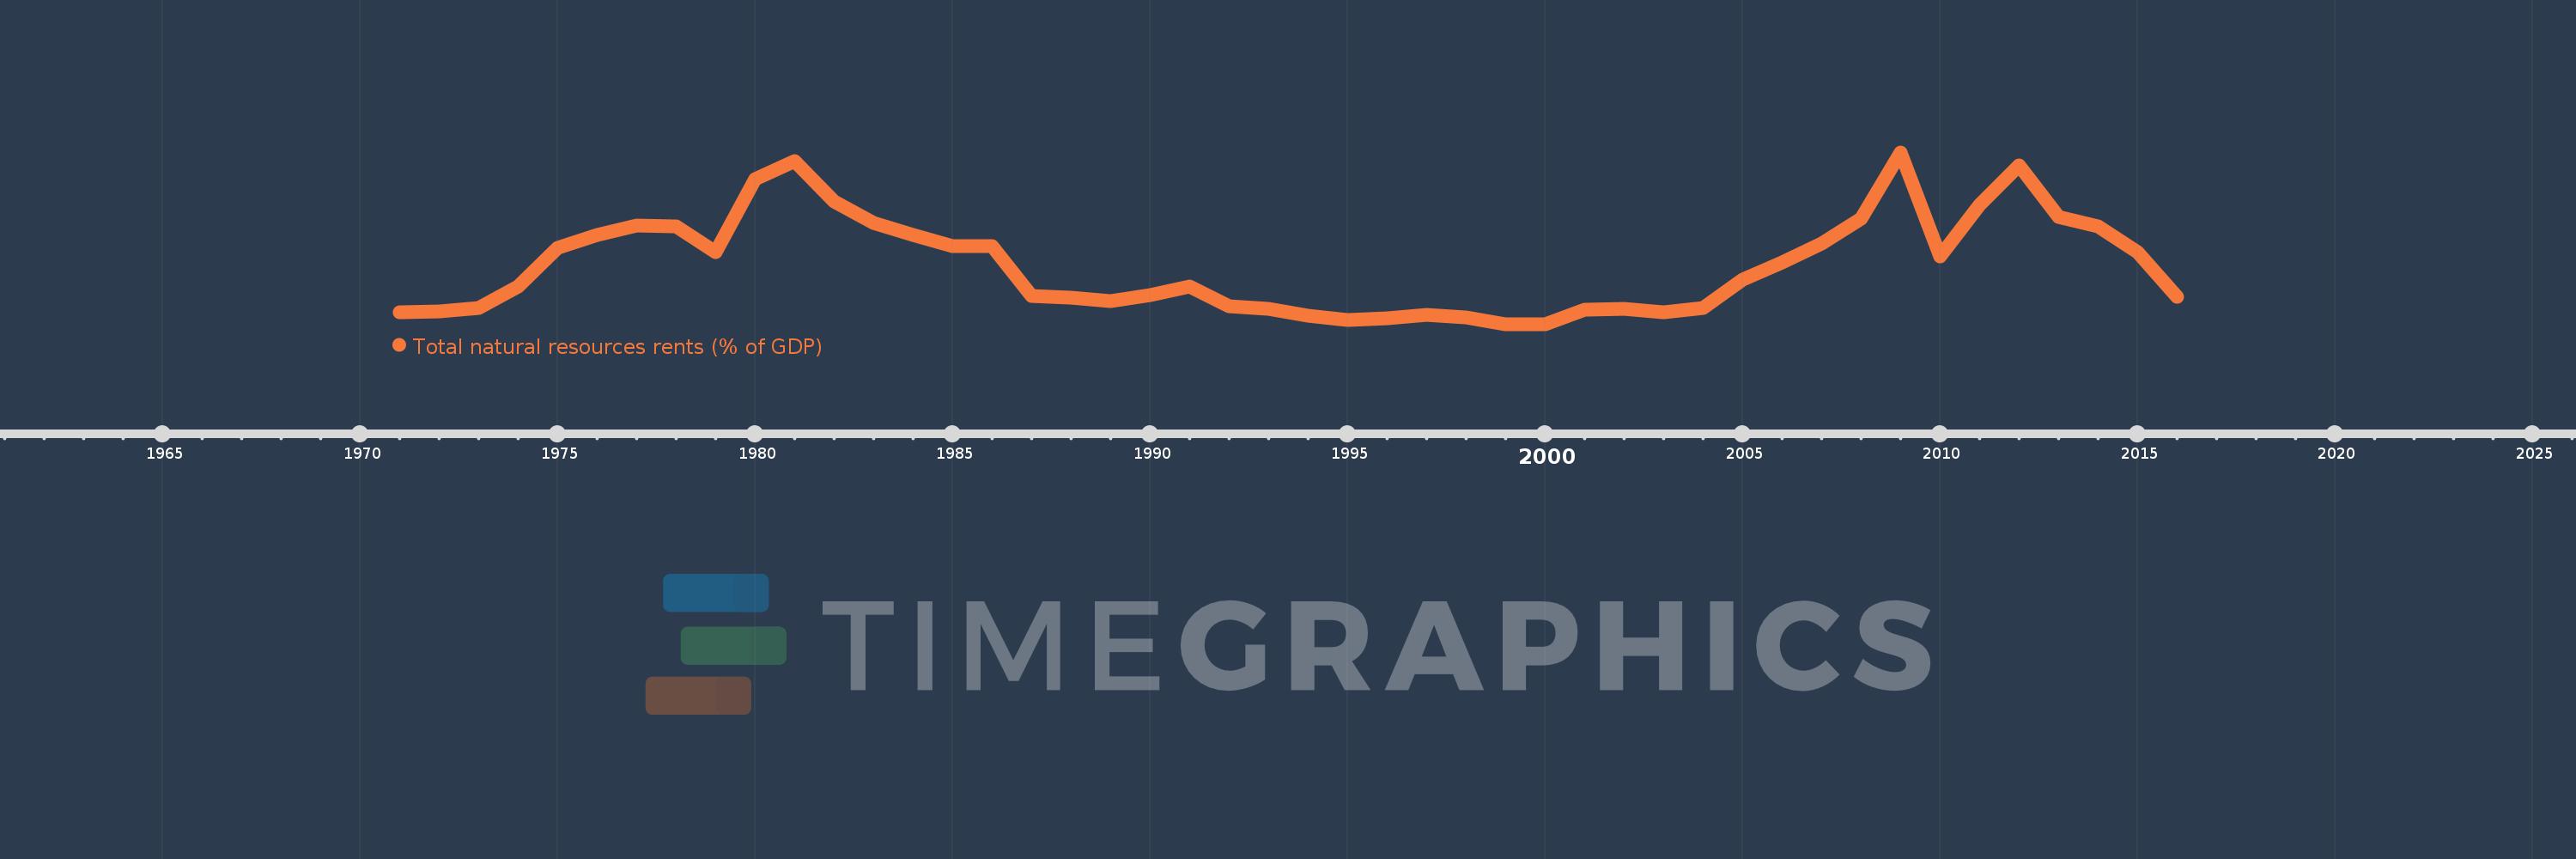
Total natural resources rents (% of GDP)
2016,2015,2014,2013,2012,2011,2010,2009,2008,2007,2006,2005,2004,2003,2002,2001,2000,1999,1998,1997,1996,1995,1994,1993,1992,1991,1990,1989,1988,1987,1986,1985,1984,1983,1982,1981,1980,1979,1978,1977,1976,1975,1974,1973,1972,1971
This statistics in other country:
AfghanistanAlbaniaAlgeriaAngolaArab WorldArgentinaArmeniaArubaAustraliaAustriaAzerbaijanBahamas, TheBahrainBangladeshBarbadosBelarusBelgiumBelizeBeninBhutanBoliviaBosnia and HerzegovinaBotswanaBrazilBrunei DarussalamBulgariaBurkina FasoBurundiCabo VerdeCambodiaCameroonCanadaCaribbean small statesCentral African RepublicCentral Europe and the BalticsChadChileChinaColombiaComorosCongo, Dem. Rep.Congo, Rep.Costa RicaCote d'IvoireCroatiaCubaCyprusCzech RepublicDenmarkDjiboutiDominicaDominican RepublicEarly-demographic dividendEast Asia & PacificEast Asia & Pacific (excluding high income)East Asia & Pacific (IDA & IBRD countries)EcuadorEgypt, Arab Rep.El SalvadorEquatorial GuineaEritreaEstoniaEthiopiaEuro areaEurope & Central AsiaEurope & Central Asia (excluding high income)Europe & Central Asia (IDA & IBRD countries)European UnionFijiFinlandFragile and conflict affected situationsFranceFrench PolynesiaGabonGambia, TheGeorgiaGermanyGhanaGreeceGuatemalaGuineaGuinea-BissauGuyanaHaitiHeavily indebted poor countries (HIPC)High incomeHondurasHong Kong SAR, ChinaHungaryIBRD onlyIcelandIDA & IBRD totalIDA blendIDA onlyIDA totalIndiaIndonesiaIran, Islamic Rep.IraqIrelandIsraelItalyJamaicaJapanJordanKazakhstanKenyaKiribatiKorea, Rep.KuwaitKyrgyz RepublicLao PDRLate-demographic dividendLatin America & Caribbean Latin America & Caribbean (excluding high income)Latin America & the Caribbean (IDA & IBRD countries)LatviaLeast developed countries: UN classificationLebanonLesothoLiberiaLibyaLithuaniaLow & middle incomeLow incomeLower middle incomeLuxembourgMacao SAR, ChinaMacedonia, FYRMadagascarMalawiMalaysiaMaldivesMaliMaltaMauritaniaMauritiusMexicoMiddle East & North AfricaMiddle East & North Africa (excluding high income)Middle East & North Africa (IDA & IBRD countries)Middle incomeMoldovaMongoliaMontenegroMoroccoMozambiqueMyanmarNamibiaNepalNetherlandsNew CaledoniaNew ZealandNicaraguaNigerNigeriaNorth AmericaNorwayOECD membersOmanOther small statesPacific island small statesPakistanPanamaPapua New GuineaParaguayPeruPhilippinesPolandPortugalPost-demographic dividendPre-demographic dividendQatarRomaniaRussian FederationRwandaSamoaSao Tome and PrincipeSaudi ArabiaSenegalSerbiaSeychellesSierra LeoneSingaporeSlovak RepublicSloveniaSmall statesSolomon IslandsSouth AfricaSouth AsiaSouth Asia (IDA & IBRD)South SudanSpainSri LankaSt. LuciaSt. Vincent and the GrenadinesSub-Saharan Africa Sub-Saharan Africa (excluding high income)Sub-Saharan Africa (IDA & IBRD countries)SudanSurinameSwazilandSwedenSwitzerlandSyrian Arab RepublicTajikistanTanzaniaThailandTimor-LesteTogoTongaTrinidad and TobagoTunisiaTurkeyTurkmenistanUgandaUkraineUnited Arab EmiratesUnited KingdomUnited StatesUpper middle incomeUruguayUzbekistanVanuatuVenezuela, RBVietnamWorldYemen, Rep.ZambiaZimbabwe Timeline:
This timeline shows a graph from 1971 to 2016 of East Asia & Pacific. No data until 1970. Number of actual observations by date: 46.
Source name:
World Development Indicators
Source organization:
Estimates based on sources and methods described in "The Changing Wealth of Nations: Measuring Sustainable Development in the New Millennium" (World Bank, 2011).
Categories, topics:
Energy & Mining, Environment
Last updated:
apr 23, 2017
Indicators value changes by year
At the date of observation
Value
Absolute change
Change from previous value
jan 1, 1971
0.863
+0.863
0.0%
jan 1, 1972
0.893
+0.03
3.5%
jan 1, 1973
0.983
+0.09
10.08%
jan 1, 1974
1.537
+0.554
56.32%
jan 1, 1975
2.516
+0.979
63.69%
jan 1, 1976
2.837
+0.321
12.74%
jan 1, 1977
3.079
+0.242
8.52%
jan 1, 1978
3.061
-0.018
-0.57%
jan 1, 1979
2.412
-0.649
-21.2%
jan 1, 1980
4.268
+1.856
76.95%
jan 1, 1981
4.714
+0.446
10.44%
jan 1, 1982
3.699
-1.015
-21.54%
jan 1, 1983
3.139
-0.56
-15.13%
jan 1, 1984
2.838
-0.301
-9.59%
jan 1, 1985
2.549
-0.289
-10.2%
jan 1, 1986
2.561
+0.012
0.48%
jan 1, 1987
1.28
-1.28
-50.0%
jan 1, 1988
1.253
-0.027
-2.11%
jan 1, 1989
1.163
-0.09
-7.17%
jan 1, 1990
1.317
+0.153
13.19%
jan 1, 1991
1.536
+0.219
16.61%
jan 1, 1992
1.026
-0.509
-33.16%
jan 1, 1993
0.948
-0.079
-7.69%
jan 1, 1994
0.774
-0.173
-18.29%
jan 1, 1995
0.681
-0.093
-12.05%
jan 1, 1996
0.708
+0.027
4.03%
jan 1, 1997
0.799
+0.09
12.75%
jan 1, 1998
0.73
-0.068
-8.57%
jan 1, 1999
0.566
-0.164
-22.45%
jan 1, 2000
0.567
+0.001
0.18%
jan 1, 2001
0.927
+0.359
63.35%
jan 1, 2002
0.966
+0.039
4.25%
jan 1, 2003
0.873
-0.093
-9.59%
jan 1, 2004
0.978
+0.104
11.96%
jan 1, 2005
1.692
+0.714
73.04%
jan 1, 2006
2.137
+0.445
26.27%
jan 1, 2007
2.623
+0.486
22.75%
jan 1, 2008
3.257
+0.634
24.19%
jan 1, 2009
4.945
+1.688
51.82%
jan 1, 2010
2.303
-2.642
-53.43%
jan 1, 2011
3.6
+1.297
56.33%
jan 1, 2012
4.612
+1.013
28.14%
jan 1, 2013
3.291
-1.321
-28.64%
jan 1, 2014
3.062
-0.229
-6.97%
jan 1, 2015
2.413
-0.649
-21.2%
jan 1, 2016
1.263
-1.15
-47.66%
Ranking of countries by current statistics by years


Comments: