29
/
en
AIzaSyAYiBZKx7MnpbEhh9jyipgxe19OcubqV5w
April 1, 2024
124295
Ecuador
ECU
true
2
1
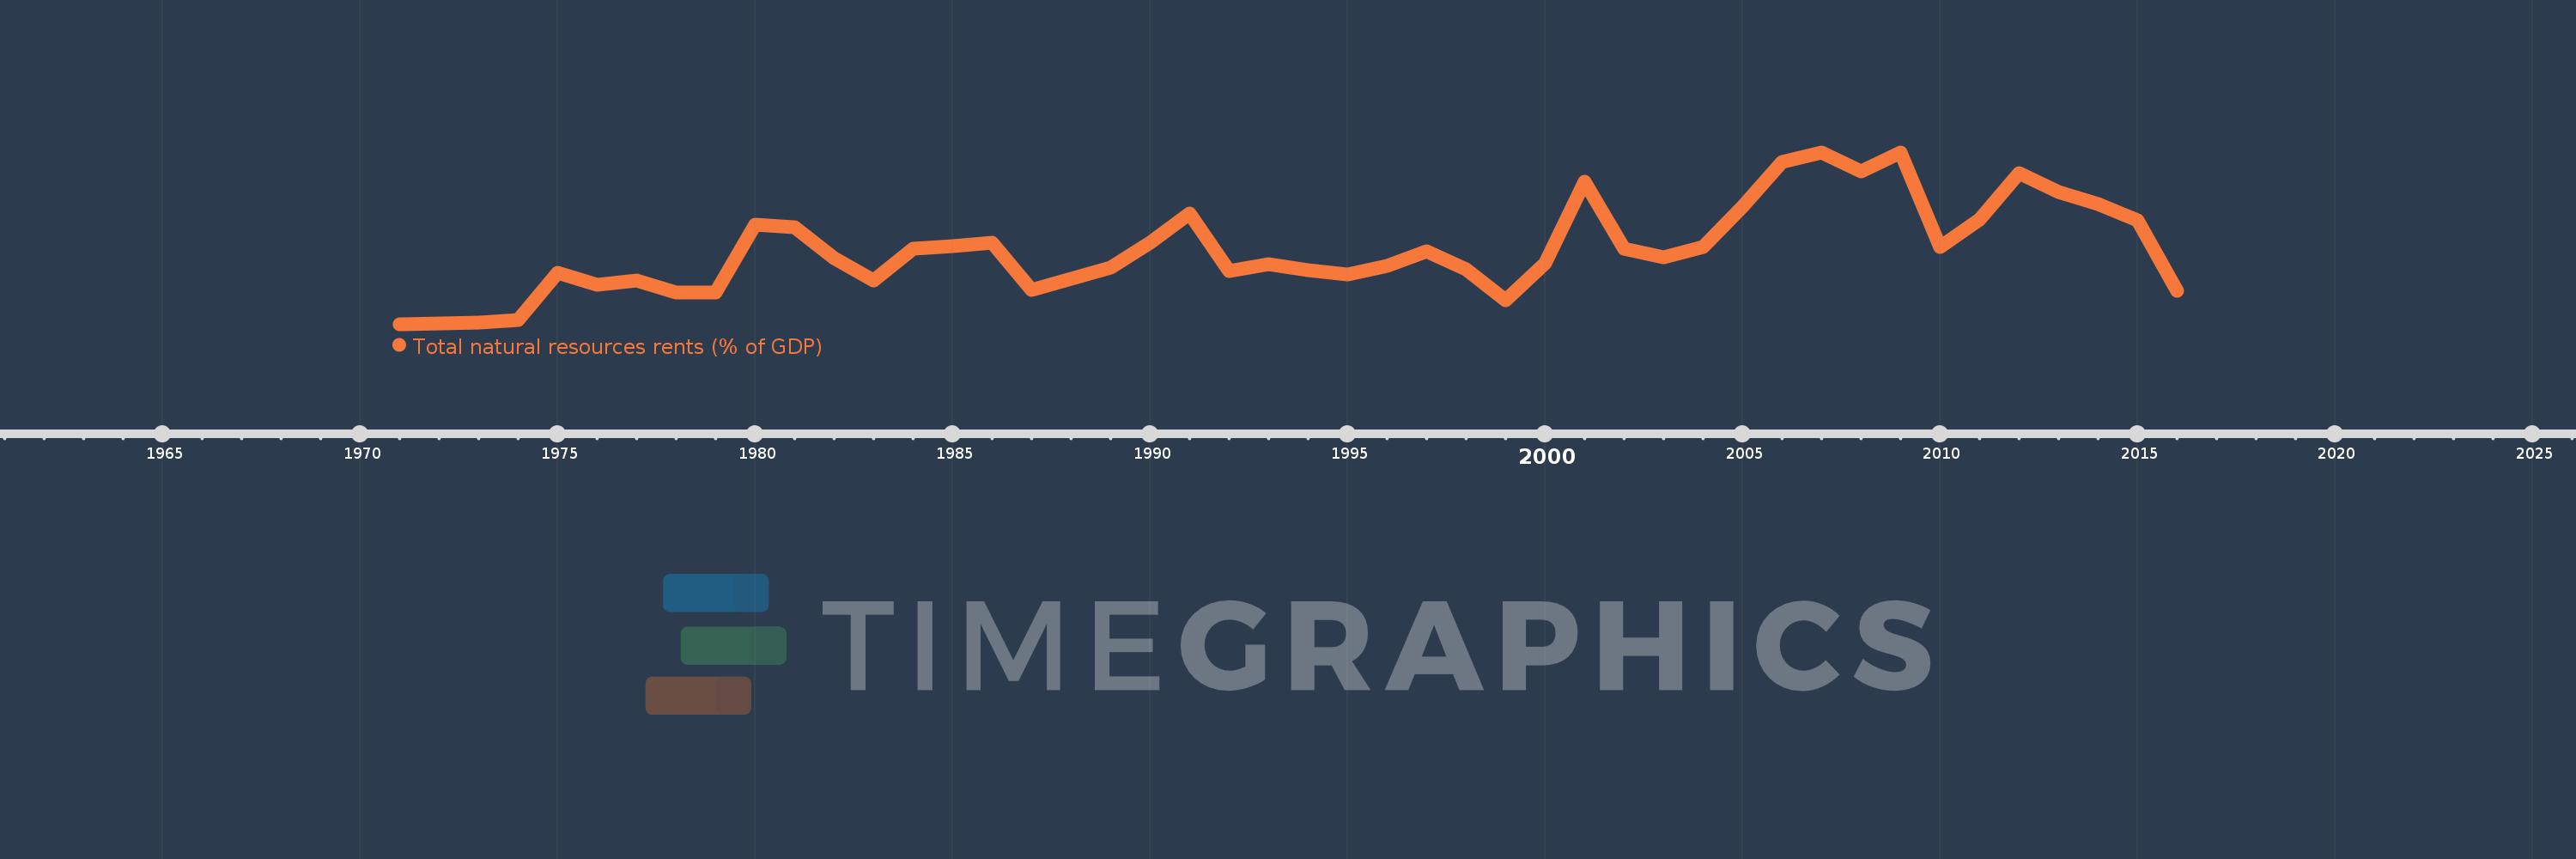
Total natural resources rents (% of GDP)
2016,2015,2014,2013,2012,2011,2010,2009,2008,2007,2006,2005,2004,2003,2002,2001,2000,1999,1998,1997,1996,1995,1994,1993,1992,1991,1990,1989,1988,1987,1986,1985,1984,1983,1982,1981,1980,1979,1978,1977,1976,1975,1974,1973,1972,1971
This statistics in other country:
AfghanistanAlbaniaAlgeriaAngolaArab WorldArgentinaArmeniaArubaAustraliaAustriaAzerbaijanBahamas, TheBahrainBangladeshBarbadosBelarusBelgiumBelizeBeninBhutanBoliviaBosnia and HerzegovinaBotswanaBrazilBrunei DarussalamBulgariaBurkina FasoBurundiCabo VerdeCambodiaCameroonCanadaCaribbean small statesCentral African RepublicCentral Europe and the BalticsChadChileChinaColombiaComorosCongo, Dem. Rep.Congo, Rep.Costa RicaCote d'IvoireCroatiaCubaCyprusCzech RepublicDenmarkDjiboutiDominicaDominican RepublicEarly-demographic dividendEast Asia & PacificEast Asia & Pacific (excluding high income)East Asia & Pacific (IDA & IBRD countries)EcuadorEgypt, Arab Rep.El SalvadorEquatorial GuineaEritreaEstoniaEthiopiaEuro areaEurope & Central AsiaEurope & Central Asia (excluding high income)Europe & Central Asia (IDA & IBRD countries)European UnionFijiFinlandFragile and conflict affected situationsFranceFrench PolynesiaGabonGambia, TheGeorgiaGermanyGhanaGreeceGuatemalaGuineaGuinea-BissauGuyanaHaitiHeavily indebted poor countries (HIPC)High incomeHondurasHong Kong SAR, ChinaHungaryIBRD onlyIcelandIDA & IBRD totalIDA blendIDA onlyIDA totalIndiaIndonesiaIran, Islamic Rep.IraqIrelandIsraelItalyJamaicaJapanJordanKazakhstanKenyaKiribatiKorea, Rep.KuwaitKyrgyz RepublicLao PDRLate-demographic dividendLatin America & Caribbean Latin America & Caribbean (excluding high income)Latin America & the Caribbean (IDA & IBRD countries)LatviaLeast developed countries: UN classificationLebanonLesothoLiberiaLibyaLithuaniaLow & middle incomeLow incomeLower middle incomeLuxembourgMacao SAR, ChinaMacedonia, FYRMadagascarMalawiMalaysiaMaldivesMaliMaltaMauritaniaMauritiusMexicoMiddle East & North AfricaMiddle East & North Africa (excluding high income)Middle East & North Africa (IDA & IBRD countries)Middle incomeMoldovaMongoliaMontenegroMoroccoMozambiqueMyanmarNamibiaNepalNetherlandsNew CaledoniaNew ZealandNicaraguaNigerNigeriaNorth AmericaNorwayOECD membersOmanOther small statesPacific island small statesPakistanPanamaPapua New GuineaParaguayPeruPhilippinesPolandPortugalPost-demographic dividendPre-demographic dividendQatarRomaniaRussian FederationRwandaSamoaSao Tome and PrincipeSaudi ArabiaSenegalSerbiaSeychellesSierra LeoneSingaporeSlovak RepublicSloveniaSmall statesSolomon IslandsSouth AfricaSouth AsiaSouth Asia (IDA & IBRD)South SudanSpainSri LankaSt. LuciaSt. Vincent and the GrenadinesSub-Saharan Africa Sub-Saharan Africa (excluding high income)Sub-Saharan Africa (IDA & IBRD countries)SudanSurinameSwazilandSwedenSwitzerlandSyrian Arab RepublicTajikistanTanzaniaThailandTimor-LesteTogoTongaTrinidad and TobagoTunisiaTurkeyTurkmenistanUgandaUkraineUnited Arab EmiratesUnited KingdomUnited StatesUpper middle incomeUruguayUzbekistanVanuatuVenezuela, RBVietnamWorldYemen, Rep.ZambiaZimbabwe Timeline:
This timeline shows a graph from 1971 to 2016 of Ecuador. No data until 1970. Number of actual observations by date: 46.
Source name:
World Development Indicators
Source organization:
Estimates based on sources and methods described in "The Changing Wealth of Nations: Measuring Sustainable Development in the New Millennium" (World Bank, 2011).
Categories, topics:
Energy & Mining, Environment
Last updated:
apr 23, 2017
Indicators value changes by year
At the date of observation
Value
Absolute change
Change from previous value
jan 1, 1971
0.582
+0.582
0.0%
jan 1, 1972
0.69
+0.107
18.4%
jan 1, 1973
0.733
+0.044
6.32%
jan 1, 1974
1.0
+0.267
36.35%
jan 1, 1975
5.592
+4.593
459.41%
jan 1, 1976
4.479
-1.113
-19.9%
jan 1, 1977
4.913
+0.434
9.69%
jan 1, 1978
3.686
-1.227
-24.97%
jan 1, 1979
3.711
+0.025
0.68%
jan 1, 1980
10.333
+6.622
178.41%
jan 1, 1981
10.141
-0.192
-1.86%
jan 1, 1982
7.032
-3.109
-30.66%
jan 1, 1983
4.883
-2.149
-30.56%
jan 1, 1984
7.999
+3.116
63.81%
jan 1, 1985
8.265
+0.266
3.32%
jan 1, 1986
8.614
+0.349
4.22%
jan 1, 1987
3.914
-4.7
-54.56%
jan 1, 1988
5.083
+1.169
29.88%
jan 1, 1989
6.13
+1.047
20.59%
jan 1, 1990
8.628
+2.498
40.75%
jan 1, 1991
11.481
+2.854
33.08%
jan 1, 1992
5.775
-5.707
-49.7%
jan 1, 1993
6.473
+0.698
12.08%
jan 1, 1994
5.871
-0.602
-9.3%
jan 1, 1995
5.506
-0.365
-6.21%
jan 1, 1996
6.304
+0.798
14.49%
jan 1, 1997
7.709
+1.405
22.29%
jan 1, 1998
5.959
-1.75
-22.7%
jan 1, 1999
2.902
-3.057
-51.3%
jan 1, 2000
6.581
+3.679
126.76%
jan 1, 2001
14.563
+7.982
121.28%
jan 1, 2002
7.998
-6.565
-45.08%
jan 1, 2003
7.168
-0.83
-10.37%
jan 1, 2004
8.126
+0.957
13.35%
jan 1, 2005
12.137
+4.011
49.37%
jan 1, 2006
16.531
+4.394
36.2%
jan 1, 2007
17.444
+0.913
5.52%
jan 1, 2008
15.604
-1.84
-10.55%
jan 1, 2009
17.45
+1.846
11.83%
jan 1, 2010
8.125
-9.326
-53.44%
jan 1, 2011
10.867
+2.743
33.76%
jan 1, 2012
15.436
+4.568
42.04%
jan 1, 2013
13.56
-1.876
-12.15%
jan 1, 2014
12.354
-1.205
-8.89%
jan 1, 2015
10.794
-1.56
-12.63%
jan 1, 2016
3.859
-6.936
-64.25%
Ranking of countries by current statistics by years


Comments: