29
/
en
AIzaSyAYiBZKx7MnpbEhh9jyipgxe19OcubqV5w
April 1, 2024
61249
Sub-Saharan Africa (IDA & IBRD countries)
TSS
false
2
1
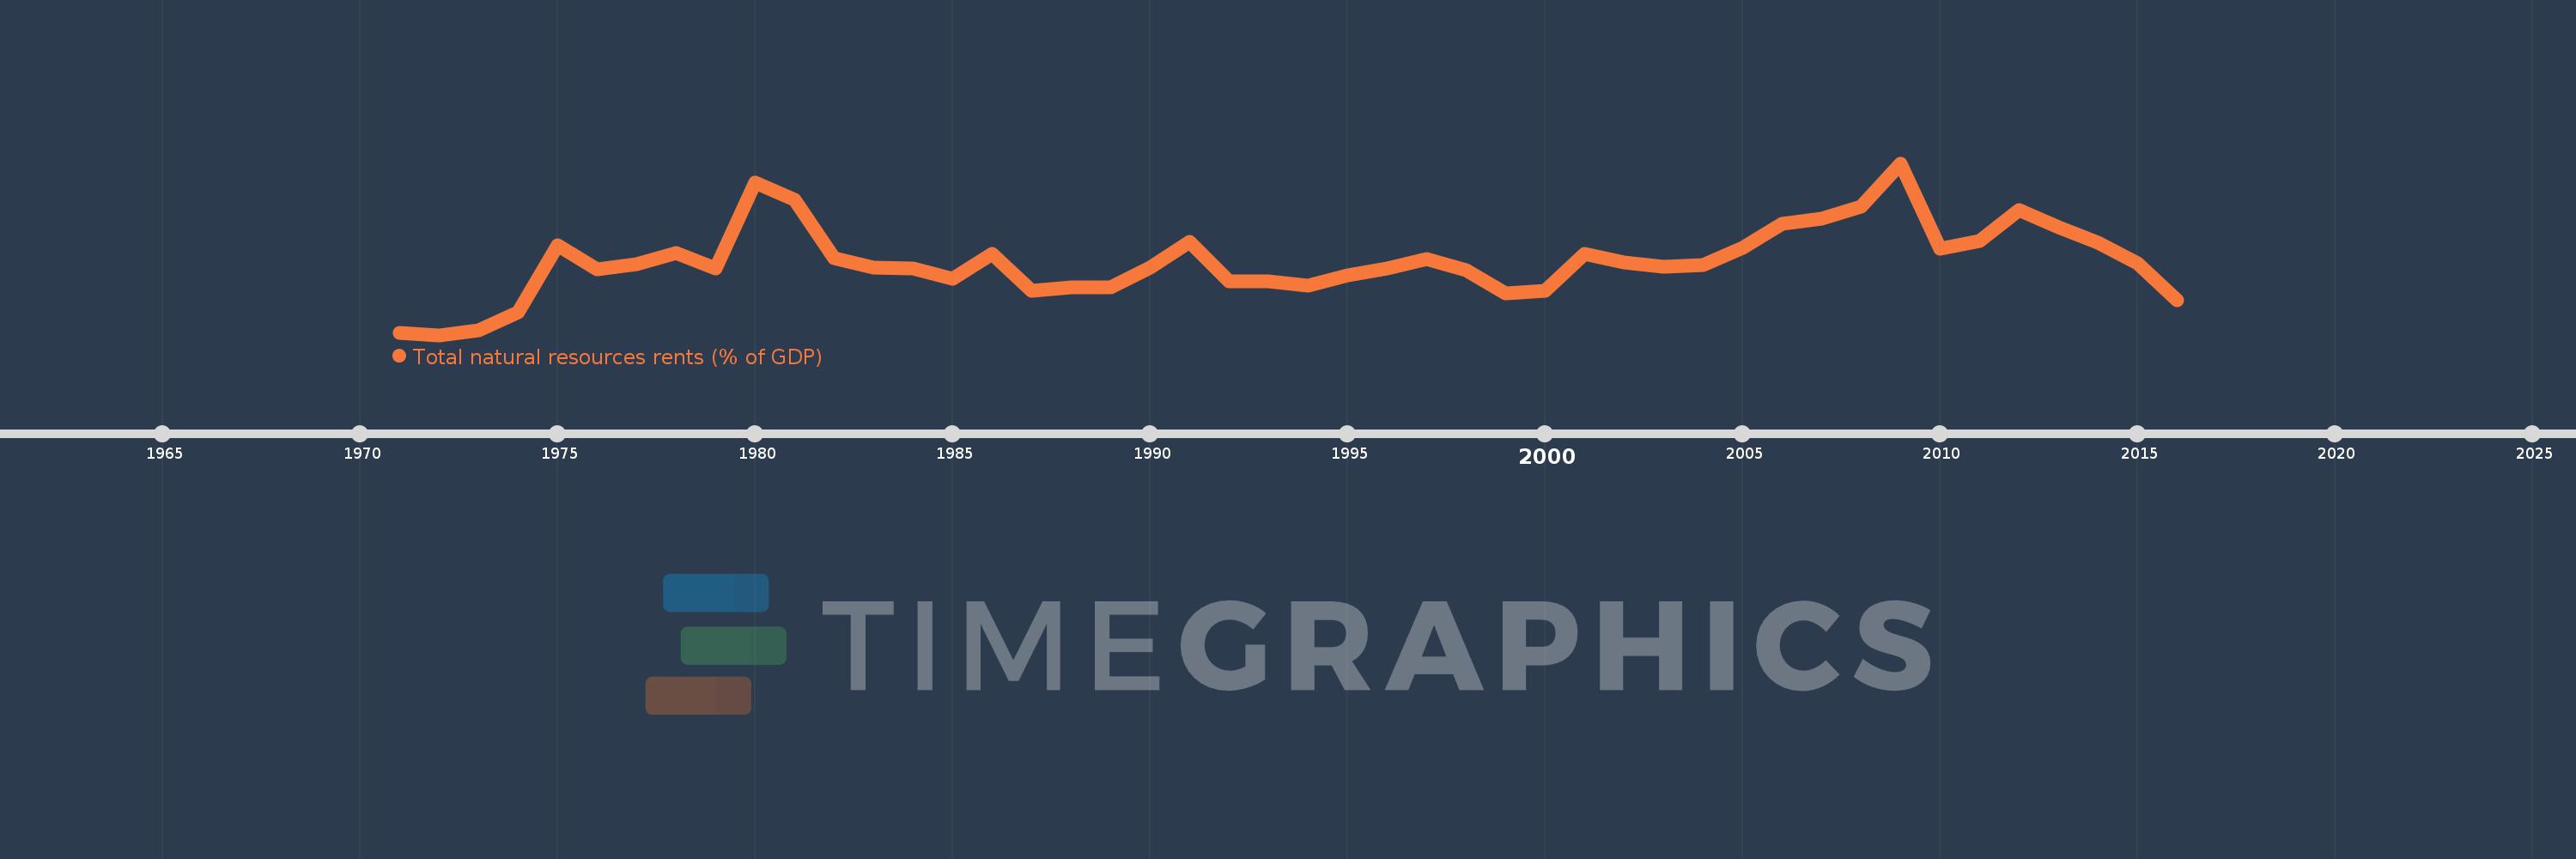
Total natural resources rents (% of GDP)
2016,2015,2014,2013,2012,2011,2010,2009,2008,2007,2006,2005,2004,2003,2002,2001,2000,1999,1998,1997,1996,1995,1994,1993,1992,1991,1990,1989,1988,1987,1986,1985,1984,1983,1982,1981,1980,1979,1978,1977,1976,1975,1974,1973,1972,1971
This statistics in other country:
AfghanistanAlbaniaAlgeriaAngolaArab WorldArgentinaArmeniaArubaAustraliaAustriaAzerbaijanBahamas, TheBahrainBangladeshBarbadosBelarusBelgiumBelizeBeninBhutanBoliviaBosnia and HerzegovinaBotswanaBrazilBrunei DarussalamBulgariaBurkina FasoBurundiCabo VerdeCambodiaCameroonCanadaCaribbean small statesCentral African RepublicCentral Europe and the BalticsChadChileChinaColombiaComorosCongo, Dem. Rep.Congo, Rep.Costa RicaCote d'IvoireCroatiaCubaCyprusCzech RepublicDenmarkDjiboutiDominicaDominican RepublicEarly-demographic dividendEast Asia & PacificEast Asia & Pacific (excluding high income)East Asia & Pacific (IDA & IBRD countries)EcuadorEgypt, Arab Rep.El SalvadorEquatorial GuineaEritreaEstoniaEthiopiaEuro areaEurope & Central AsiaEurope & Central Asia (excluding high income)Europe & Central Asia (IDA & IBRD countries)European UnionFijiFinlandFragile and conflict affected situationsFranceFrench PolynesiaGabonGambia, TheGeorgiaGermanyGhanaGreeceGuatemalaGuineaGuinea-BissauGuyanaHaitiHeavily indebted poor countries (HIPC)High incomeHondurasHong Kong SAR, ChinaHungaryIBRD onlyIcelandIDA & IBRD totalIDA blendIDA onlyIDA totalIndiaIndonesiaIran, Islamic Rep.IraqIrelandIsraelItalyJamaicaJapanJordanKazakhstanKenyaKiribatiKorea, Rep.KuwaitKyrgyz RepublicLao PDRLate-demographic dividendLatin America & Caribbean Latin America & Caribbean (excluding high income)Latin America & the Caribbean (IDA & IBRD countries)LatviaLeast developed countries: UN classificationLebanonLesothoLiberiaLibyaLithuaniaLow & middle incomeLow incomeLower middle incomeLuxembourgMacao SAR, ChinaMacedonia, FYRMadagascarMalawiMalaysiaMaldivesMaliMaltaMauritaniaMauritiusMexicoMiddle East & North AfricaMiddle East & North Africa (excluding high income)Middle East & North Africa (IDA & IBRD countries)Middle incomeMoldovaMongoliaMontenegroMoroccoMozambiqueMyanmarNamibiaNepalNetherlandsNew CaledoniaNew ZealandNicaraguaNigerNigeriaNorth AmericaNorwayOECD membersOmanOther small statesPacific island small statesPakistanPanamaPapua New GuineaParaguayPeruPhilippinesPolandPortugalPost-demographic dividendPre-demographic dividendQatarRomaniaRussian FederationRwandaSamoaSao Tome and PrincipeSaudi ArabiaSenegalSerbiaSeychellesSierra LeoneSingaporeSlovak RepublicSloveniaSmall statesSolomon IslandsSouth AfricaSouth AsiaSouth Asia (IDA & IBRD)South SudanSpainSri LankaSt. LuciaSt. Vincent and the GrenadinesSub-Saharan Africa Sub-Saharan Africa (excluding high income)Sub-Saharan Africa (IDA & IBRD countries)SudanSurinameSwazilandSwedenSwitzerlandSyrian Arab RepublicTajikistanTanzaniaThailandTimor-LesteTogoTongaTrinidad and TobagoTunisiaTurkeyTurkmenistanUgandaUkraineUnited Arab EmiratesUnited KingdomUnited StatesUpper middle incomeUruguayUzbekistanVanuatuVenezuela, RBVietnamWorldYemen, Rep.ZambiaZimbabwe Timeline:
This timeline shows a graph from 1971 to 2016 of Sub-Saharan Africa (IDA & IBRD countries). No data until 1970. Number of actual observations by date: 46.
Source name:
World Development Indicators
Source organization:
Estimates based on sources and methods described in "The Changing Wealth of Nations: Measuring Sustainable Development in the New Millennium" (World Bank, 2011).
Categories, topics:
Energy & Mining, Environment
Last updated:
apr 23, 2017
Indicators value changes by year
Maximum:
23.969
jan 1, 2009
At the date of observation
Value
Absolute change
Change from previous value
jan 1, 1971
4.218
+4.218
0.0%
jan 1, 1972
3.98
-0.238
-5.63%
jan 1, 1973
4.483
+0.503
12.63%
jan 1, 1974
6.614
+2.131
47.53%
jan 1, 1975
14.457
+7.843
118.58%
jan 1, 1976
11.601
-2.856
-19.76%
jan 1, 1977
12.181
+0.58
5.0%
jan 1, 1978
13.486
+1.305
10.71%
jan 1, 1979
11.766
-1.72
-12.75%
jan 1, 1980
21.733
+9.967
84.71%
jan 1, 1981
19.717
-2.016
-9.28%
jan 1, 1982
12.878
-6.839
-34.68%
jan 1, 1983
11.807
-1.072
-8.32%
jan 1, 1984
11.755
-0.052
-0.44%
jan 1, 1985
10.547
-1.207
-10.27%
jan 1, 1986
13.459
+2.912
27.61%
jan 1, 1987
9.175
-4.285
-31.83%
jan 1, 1988
9.505
+0.33
3.6%
jan 1, 1989
9.561
+0.057
0.6%
jan 1, 1990
11.851
+2.29
23.95%
jan 1, 1991
14.874
+3.022
25.5%
jan 1, 1992
10.233
-4.64
-31.2%
jan 1, 1993
10.246
+0.013
0.12%
jan 1, 1994
9.709
-0.536
-5.24%
jan 1, 1995
10.899
+1.19
12.26%
jan 1, 1996
11.763
+0.863
7.92%
jan 1, 1997
12.836
+1.074
9.13%
jan 1, 1998
11.486
-1.351
-10.52%
jan 1, 1999
8.805
-2.68
-23.34%
jan 1, 2000
9.159
+0.353
4.01%
jan 1, 2001
13.388
+4.229
46.18%
jan 1, 2002
12.422
-0.966
-7.21%
jan 1, 2003
11.933
-0.489
-3.94%
jan 1, 2004
12.133
+0.2
1.68%
jan 1, 2005
14.136
+2.002
16.5%
jan 1, 2006
16.895
+2.759
19.52%
jan 1, 2007
17.547
+0.652
3.86%
jan 1, 2008
18.887
+1.34
7.64%
jan 1, 2009
23.969
+5.083
26.91%
jan 1, 2010
14.034
-9.936
-41.45%
jan 1, 2011
14.958
+0.924
6.58%
jan 1, 2012
18.554
+3.596
24.04%
jan 1, 2013
16.55
-2.003
-10.8%
jan 1, 2014
14.677
-1.873
-11.32%
jan 1, 2015
12.289
-2.389
-16.27%
jan 1, 2016
7.997
-4.292
-34.93%
Ranking of countries by current statistics by years


Comments: