29
/
en
AIzaSyAYiBZKx7MnpbEhh9jyipgxe19OcubqV5w
April 1, 2024
273063
Uganda
UGA
true
2
1
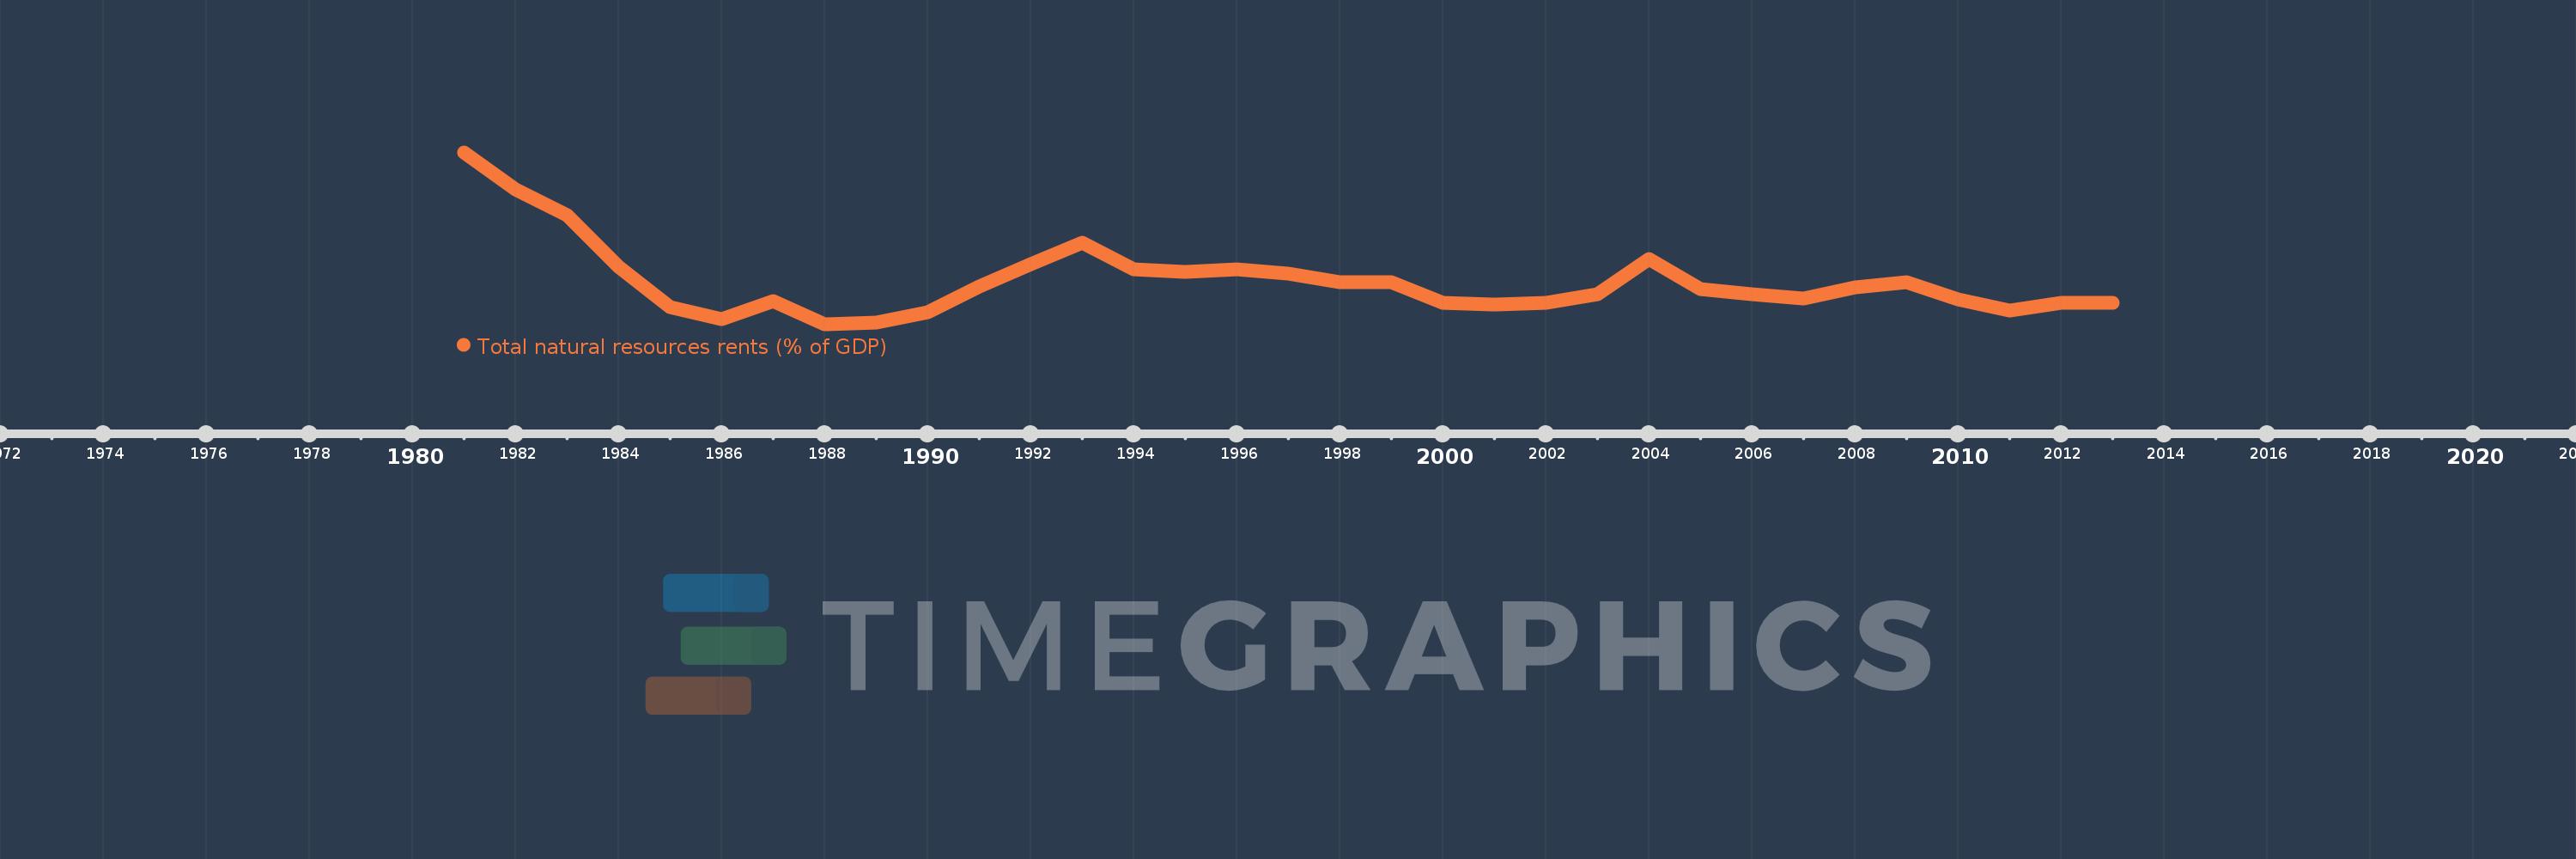
Total natural resources rents (% of GDP)
2013,2012,2011,2010,2009,2008,2007,2006,2005,2004,2003,2002,2001,2000,1999,1998,1997,1996,1995,1994,1993,1992,1991,1990,1989,1988,1987,1986,1985,1984,1983,1982,1981
This statistics in other country:
AfghanistanAlbaniaAlgeriaAngolaArab WorldArgentinaArmeniaArubaAustraliaAustriaAzerbaijanBahamas, TheBahrainBangladeshBarbadosBelarusBelgiumBelizeBeninBhutanBoliviaBosnia and HerzegovinaBotswanaBrazilBrunei DarussalamBulgariaBurkina FasoBurundiCabo VerdeCambodiaCameroonCanadaCaribbean small statesCentral African RepublicCentral Europe and the BalticsChadChileChinaColombiaComorosCongo, Dem. Rep.Congo, Rep.Costa RicaCote d'IvoireCroatiaCubaCyprusCzech RepublicDenmarkDjiboutiDominicaDominican RepublicEarly-demographic dividendEast Asia & PacificEast Asia & Pacific (excluding high income)East Asia & Pacific (IDA & IBRD countries)EcuadorEgypt, Arab Rep.El SalvadorEquatorial GuineaEritreaEstoniaEthiopiaEuro areaEurope & Central AsiaEurope & Central Asia (excluding high income)Europe & Central Asia (IDA & IBRD countries)European UnionFijiFinlandFragile and conflict affected situationsFranceFrench PolynesiaGabonGambia, TheGeorgiaGermanyGhanaGreeceGuatemalaGuineaGuinea-BissauGuyanaHaitiHeavily indebted poor countries (HIPC)High incomeHondurasHong Kong SAR, ChinaHungaryIBRD onlyIcelandIDA & IBRD totalIDA blendIDA onlyIDA totalIndiaIndonesiaIran, Islamic Rep.IraqIrelandIsraelItalyJamaicaJapanJordanKazakhstanKenyaKiribatiKorea, Rep.KuwaitKyrgyz RepublicLao PDRLate-demographic dividendLatin America & Caribbean Latin America & Caribbean (excluding high income)Latin America & the Caribbean (IDA & IBRD countries)LatviaLeast developed countries: UN classificationLebanonLesothoLiberiaLibyaLithuaniaLow & middle incomeLow incomeLower middle incomeLuxembourgMacao SAR, ChinaMacedonia, FYRMadagascarMalawiMalaysiaMaldivesMaliMaltaMauritaniaMauritiusMexicoMiddle East & North AfricaMiddle East & North Africa (excluding high income)Middle East & North Africa (IDA & IBRD countries)Middle incomeMoldovaMongoliaMontenegroMoroccoMozambiqueMyanmarNamibiaNepalNetherlandsNew CaledoniaNew ZealandNicaraguaNigerNigeriaNorth AmericaNorwayOECD membersOmanOther small statesPacific island small statesPakistanPanamaPapua New GuineaParaguayPeruPhilippinesPolandPortugalPost-demographic dividendPre-demographic dividendQatarRomaniaRussian FederationRwandaSamoaSao Tome and PrincipeSaudi ArabiaSenegalSerbiaSeychellesSierra LeoneSingaporeSlovak RepublicSloveniaSmall statesSolomon IslandsSouth AfricaSouth AsiaSouth Asia (IDA & IBRD)South SudanSpainSri LankaSt. LuciaSt. Vincent and the GrenadinesSub-Saharan Africa Sub-Saharan Africa (excluding high income)Sub-Saharan Africa (IDA & IBRD countries)SudanSurinameSwazilandSwedenSwitzerlandSyrian Arab RepublicTajikistanTanzaniaThailandTimor-LesteTogoTongaTrinidad and TobagoTunisiaTurkeyTurkmenistanUgandaUkraineUnited Arab EmiratesUnited KingdomUnited StatesUpper middle incomeUruguayUzbekistanVanuatuVenezuela, RBVietnamWorldYemen, Rep.ZambiaZimbabwe Timeline:
This timeline shows a graph from 1981 to 2013 of Uganda. No data until 1980. Number of actual observations by date: 33.
Source name:
World Development Indicators
Source organization:
Estimates based on sources and methods described in "The Changing Wealth of Nations: Measuring Sustainable Development in the New Millennium" (World Bank, 2011).
Categories, topics:
Energy & Mining, Environment
Last updated:
apr 23, 2017
Indicators value changes by year
Maximum:
44.657
jan 1, 1981
At the date of observation
Value
Absolute change
Change from previous value
jan 1, 1981
44.657
+44.657
0.0%
jan 1, 1982
36.731
-7.926
-17.75%
jan 1, 1983
31.214
-5.517
-15.02%
jan 1, 1984
20.086
-11.128
-35.65%
jan 1, 1985
11.462
-8.623
-42.93%
jan 1, 1986
8.933
-2.53
-22.07%
jan 1, 1987
12.738
+3.805
42.6%
jan 1, 1988
7.789
-4.949
-38.85%
jan 1, 1989
8.157
+0.368
4.73%
jan 1, 1990
10.329
+2.172
26.63%
jan 1, 1991
15.811
+5.481
53.07%
jan 1, 1992
20.602
+4.791
30.3%
jan 1, 1993
25.235
+4.633
22.49%
jan 1, 1994
19.499
-5.736
-22.73%
jan 1, 1995
19.003
-0.496
-2.54%
jan 1, 1996
19.509
+0.506
2.66%
jan 1, 1997
18.582
-0.927
-4.75%
jan 1, 1998
16.85
-1.732
-9.32%
jan 1, 1999
16.786
-0.064
-0.38%
jan 1, 2000
12.46
-4.326
-25.77%
jan 1, 2001
12.042
-0.418
-3.35%
jan 1, 2002
12.414
+0.372
3.09%
jan 1, 2003
14.195
+1.781
14.34%
jan 1, 2004
21.787
+7.592
53.48%
jan 1, 2005
15.245
-6.542
-30.03%
jan 1, 2006
14.151
-1.094
-7.18%
jan 1, 2007
13.357
-0.793
-5.61%
jan 1, 2008
15.694
+2.336
17.49%
jan 1, 2009
16.762
+1.068
6.81%
jan 1, 2010
13.099
-3.663
-21.85%
jan 1, 2011
10.708
-2.391
-18.25%
jan 1, 2012
12.469
+1.76
16.44%
jan 1, 2013
12.421
-0.048
-0.38%
Ranking of countries by current statistics by years


Comments: