29
/
en
AIzaSyAYiBZKx7MnpbEhh9jyipgxe19OcubqV5w
April 1, 2024
53119
OECD members
OED
false
2
1
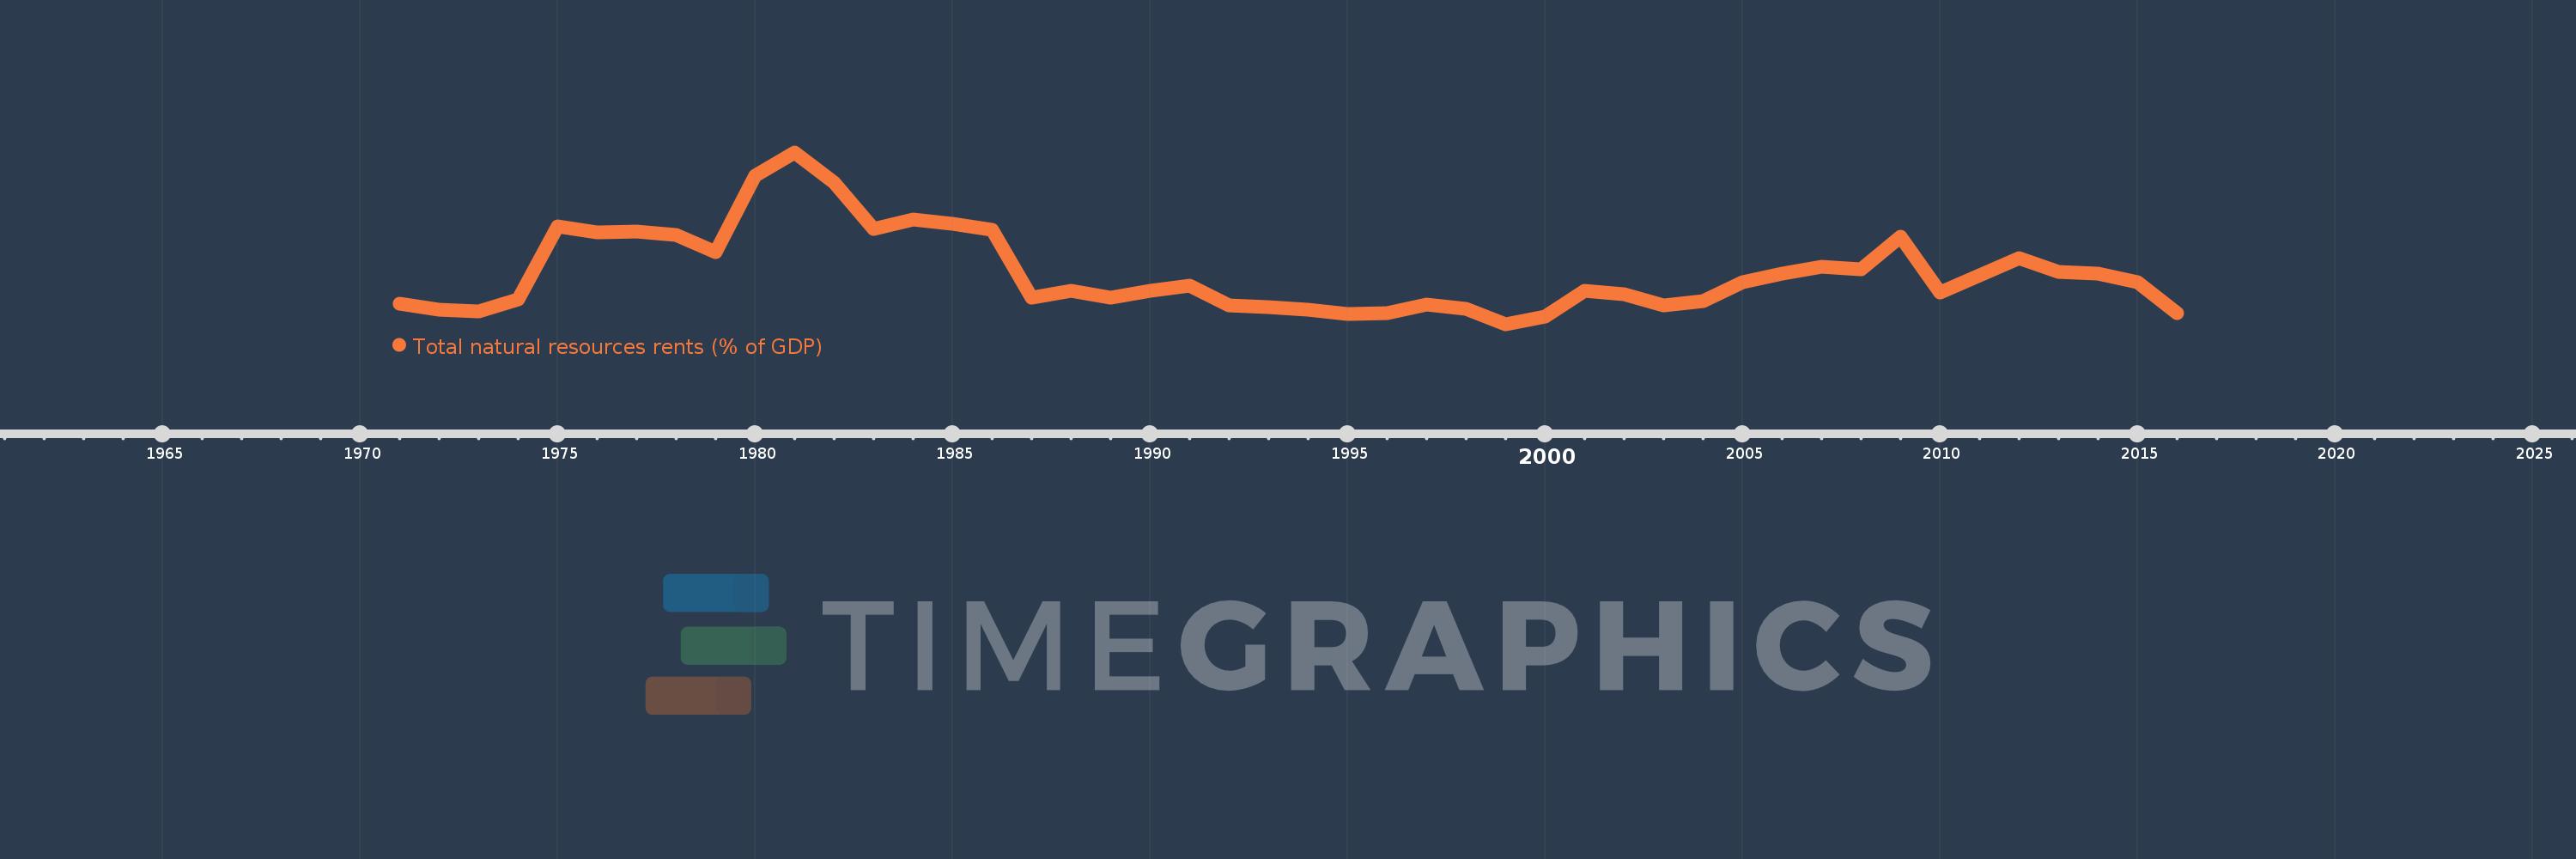
Total natural resources rents (% of GDP)
2016,2015,2014,2013,2012,2011,2010,2009,2008,2007,2006,2005,2004,2003,2002,2001,2000,1999,1998,1997,1996,1995,1994,1993,1992,1991,1990,1989,1988,1987,1986,1985,1984,1983,1982,1981,1980,1979,1978,1977,1976,1975,1974,1973,1972,1971
This statistics in other country:
AfghanistanAlbaniaAlgeriaAngolaArab WorldArgentinaArmeniaArubaAustraliaAustriaAzerbaijanBahamas, TheBahrainBangladeshBarbadosBelarusBelgiumBelizeBeninBhutanBoliviaBosnia and HerzegovinaBotswanaBrazilBrunei DarussalamBulgariaBurkina FasoBurundiCabo VerdeCambodiaCameroonCanadaCaribbean small statesCentral African RepublicCentral Europe and the BalticsChadChileChinaColombiaComorosCongo, Dem. Rep.Congo, Rep.Costa RicaCote d'IvoireCroatiaCubaCyprusCzech RepublicDenmarkDjiboutiDominicaDominican RepublicEarly-demographic dividendEast Asia & PacificEast Asia & Pacific (excluding high income)East Asia & Pacific (IDA & IBRD countries)EcuadorEgypt, Arab Rep.El SalvadorEquatorial GuineaEritreaEstoniaEthiopiaEuro areaEurope & Central AsiaEurope & Central Asia (excluding high income)Europe & Central Asia (IDA & IBRD countries)European UnionFijiFinlandFragile and conflict affected situationsFranceFrench PolynesiaGabonGambia, TheGeorgiaGermanyGhanaGreeceGuatemalaGuineaGuinea-BissauGuyanaHaitiHeavily indebted poor countries (HIPC)High incomeHondurasHong Kong SAR, ChinaHungaryIBRD onlyIcelandIDA & IBRD totalIDA blendIDA onlyIDA totalIndiaIndonesiaIran, Islamic Rep.IraqIrelandIsraelItalyJamaicaJapanJordanKazakhstanKenyaKiribatiKorea, Rep.KuwaitKyrgyz RepublicLao PDRLate-demographic dividendLatin America & Caribbean Latin America & Caribbean (excluding high income)Latin America & the Caribbean (IDA & IBRD countries)LatviaLeast developed countries: UN classificationLebanonLesothoLiberiaLibyaLithuaniaLow & middle incomeLow incomeLower middle incomeLuxembourgMacao SAR, ChinaMacedonia, FYRMadagascarMalawiMalaysiaMaldivesMaliMaltaMauritaniaMauritiusMexicoMiddle East & North AfricaMiddle East & North Africa (excluding high income)Middle East & North Africa (IDA & IBRD countries)Middle incomeMoldovaMongoliaMontenegroMoroccoMozambiqueMyanmarNamibiaNepalNetherlandsNew CaledoniaNew ZealandNicaraguaNigerNigeriaNorth AmericaNorwayOECD membersOmanOther small statesPacific island small statesPakistanPanamaPapua New GuineaParaguayPeruPhilippinesPolandPortugalPost-demographic dividendPre-demographic dividendQatarRomaniaRussian FederationRwandaSamoaSao Tome and PrincipeSaudi ArabiaSenegalSerbiaSeychellesSierra LeoneSingaporeSlovak RepublicSloveniaSmall statesSolomon IslandsSouth AfricaSouth AsiaSouth Asia (IDA & IBRD)South SudanSpainSri LankaSt. LuciaSt. Vincent and the GrenadinesSub-Saharan Africa Sub-Saharan Africa (excluding high income)Sub-Saharan Africa (IDA & IBRD countries)SudanSurinameSwazilandSwedenSwitzerlandSyrian Arab RepublicTajikistanTanzaniaThailandTimor-LesteTogoTongaTrinidad and TobagoTunisiaTurkeyTurkmenistanUgandaUkraineUnited Arab EmiratesUnited KingdomUnited StatesUpper middle incomeUruguayUzbekistanVanuatuVenezuela, RBVietnamWorldYemen, Rep.ZambiaZimbabwe Timeline:
This timeline shows a graph from 1971 to 2016 of OECD members. No data until 1970. Number of actual observations by date: 46.
Source name:
World Development Indicators
Source organization:
Estimates based on sources and methods described in "The Changing Wealth of Nations: Measuring Sustainable Development in the New Millennium" (World Bank, 2011).
Categories, topics:
Energy & Mining, Environment
Last updated:
apr 23, 2017
Indicators value changes by year
At the date of observation
Value
Absolute change
Change from previous value
jan 1, 1971
0.676
+0.676
0.0%
jan 1, 1972
0.578
-0.098
-14.5%
jan 1, 1973
0.558
-0.02
-3.44%
jan 1, 1974
0.744
+0.186
33.35%
jan 1, 1975
1.871
+1.126
151.36%
jan 1, 1976
1.771
-0.099
-5.3%
jan 1, 1977
1.79
+0.019
1.07%
jan 1, 1978
1.74
-0.05
-2.79%
jan 1, 1979
1.467
-0.273
-15.71%
jan 1, 1980
2.653
+1.186
80.82%
jan 1, 1981
3.007
+0.355
13.37%
jan 1, 1982
2.544
-0.463
-15.4%
jan 1, 1983
1.825
-0.719
-28.27%
jan 1, 1984
1.973
+0.148
8.11%
jan 1, 1985
1.907
-0.066
-3.35%
jan 1, 1986
1.811
-0.095
-5.01%
jan 1, 1987
0.766
-1.045
-57.7%
jan 1, 1988
0.872
+0.106
13.85%
jan 1, 1989
0.768
-0.104
-11.98%
jan 1, 1990
0.871
+0.103
13.42%
jan 1, 1991
0.953
+0.082
9.38%
jan 1, 1992
0.653
-0.3
-31.49%
jan 1, 1993
0.617
-0.036
-5.5%
jan 1, 1994
0.588
-0.029
-4.69%
jan 1, 1995
0.512
-0.076
-12.93%
jan 1, 1996
0.525
+0.014
2.65%
jan 1, 1997
0.664
+0.138
26.3%
jan 1, 1998
0.59
-0.074
-11.12%
jan 1, 1999
0.359
-0.231
-39.18%
jan 1, 2000
0.471
+0.112
31.36%
jan 1, 2001
0.869
+0.398
84.43%
jan 1, 2002
0.818
-0.051
-5.84%
jan 1, 2003
0.649
-0.169
-20.69%
jan 1, 2004
0.718
+0.069
10.59%
jan 1, 2005
1.002
+0.285
39.65%
jan 1, 2006
1.14
+0.138
13.77%
jan 1, 2007
1.241
+0.101
8.82%
jan 1, 2008
1.207
-0.033
-2.7%
jan 1, 2009
1.707
+0.499
41.33%
jan 1, 2010
0.841
-0.866
-50.72%
jan 1, 2011
1.107
+0.266
31.64%
jan 1, 2012
1.383
+0.276
24.97%
jan 1, 2013
1.168
-0.215
-15.57%
jan 1, 2014
1.136
-0.032
-2.73%
jan 1, 2015
1.011
-0.125
-10.99%
jan 1, 2016
0.526
-0.486
-48.03%
Ranking of countries by current statistics by years


Comments: