29
/
en
AIzaSyAYiBZKx7MnpbEhh9jyipgxe19OcubqV5w
April 1, 2024
104317
Chad
TCD
true
2
1
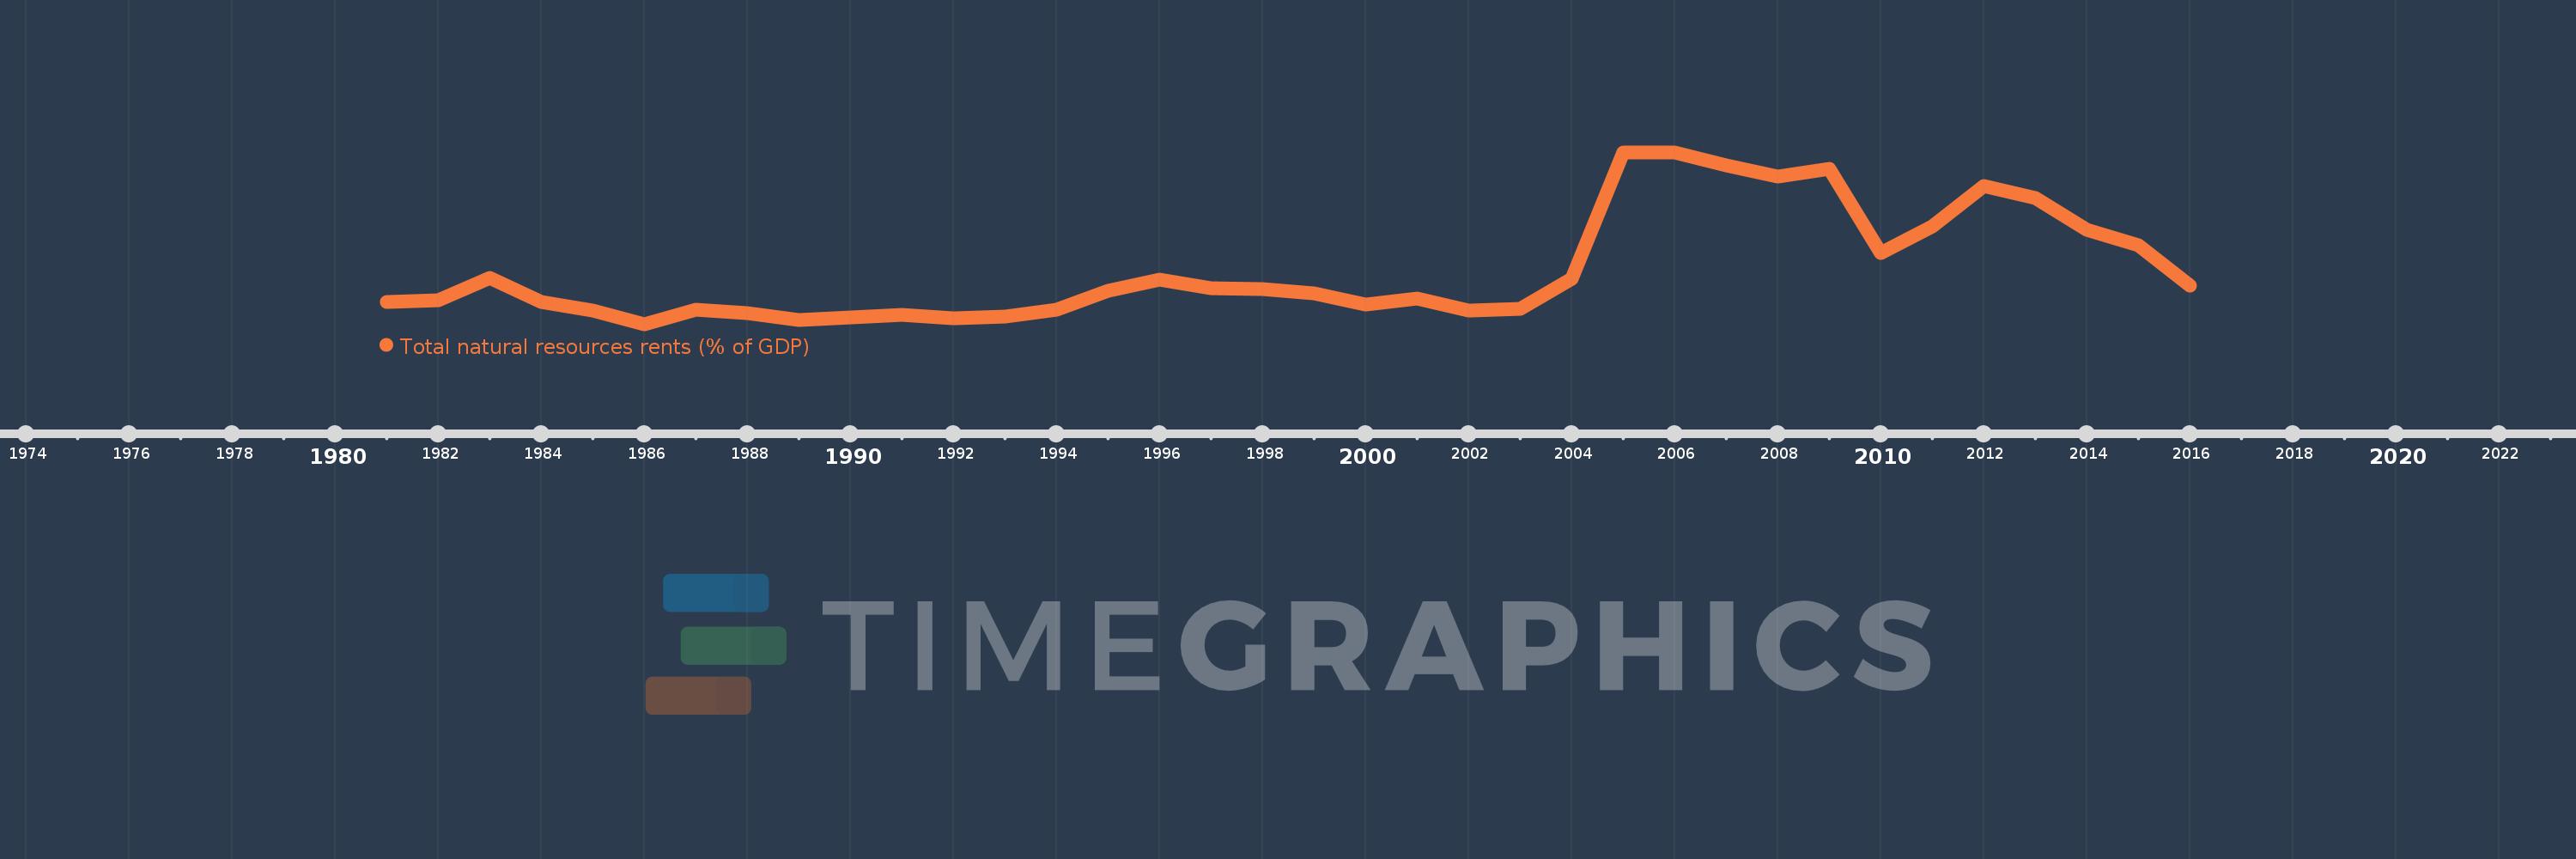
Total natural resources rents (% of GDP)
2016,2015,2014,2013,2012,2011,2010,2009,2008,2007,2006,2005,2004,2003,2002,2001,2000,1999,1998,1997,1996,1995,1994,1993,1992,1991,1990,1989,1988,1987,1986,1985,1984,1983,1982,1981
This statistics in other country:
AfghanistanAlbaniaAlgeriaAngolaArab WorldArgentinaArmeniaArubaAustraliaAustriaAzerbaijanBahamas, TheBahrainBangladeshBarbadosBelarusBelgiumBelizeBeninBhutanBoliviaBosnia and HerzegovinaBotswanaBrazilBrunei DarussalamBulgariaBurkina FasoBurundiCabo VerdeCambodiaCameroonCanadaCaribbean small statesCentral African RepublicCentral Europe and the BalticsChadChileChinaColombiaComorosCongo, Dem. Rep.Congo, Rep.Costa RicaCote d'IvoireCroatiaCubaCyprusCzech RepublicDenmarkDjiboutiDominicaDominican RepublicEarly-demographic dividendEast Asia & PacificEast Asia & Pacific (excluding high income)East Asia & Pacific (IDA & IBRD countries)EcuadorEgypt, Arab Rep.El SalvadorEquatorial GuineaEritreaEstoniaEthiopiaEuro areaEurope & Central AsiaEurope & Central Asia (excluding high income)Europe & Central Asia (IDA & IBRD countries)European UnionFijiFinlandFragile and conflict affected situationsFranceFrench PolynesiaGabonGambia, TheGeorgiaGermanyGhanaGreeceGuatemalaGuineaGuinea-BissauGuyanaHaitiHeavily indebted poor countries (HIPC)High incomeHondurasHong Kong SAR, ChinaHungaryIBRD onlyIcelandIDA & IBRD totalIDA blendIDA onlyIDA totalIndiaIndonesiaIran, Islamic Rep.IraqIrelandIsraelItalyJamaicaJapanJordanKazakhstanKenyaKiribatiKorea, Rep.KuwaitKyrgyz RepublicLao PDRLate-demographic dividendLatin America & Caribbean Latin America & Caribbean (excluding high income)Latin America & the Caribbean (IDA & IBRD countries)LatviaLeast developed countries: UN classificationLebanonLesothoLiberiaLibyaLithuaniaLow & middle incomeLow incomeLower middle incomeLuxembourgMacao SAR, ChinaMacedonia, FYRMadagascarMalawiMalaysiaMaldivesMaliMaltaMauritaniaMauritiusMexicoMiddle East & North AfricaMiddle East & North Africa (excluding high income)Middle East & North Africa (IDA & IBRD countries)Middle incomeMoldovaMongoliaMontenegroMoroccoMozambiqueMyanmarNamibiaNepalNetherlandsNew CaledoniaNew ZealandNicaraguaNigerNigeriaNorth AmericaNorwayOECD membersOmanOther small statesPacific island small statesPakistanPanamaPapua New GuineaParaguayPeruPhilippinesPolandPortugalPost-demographic dividendPre-demographic dividendQatarRomaniaRussian FederationRwandaSamoaSao Tome and PrincipeSaudi ArabiaSenegalSerbiaSeychellesSierra LeoneSingaporeSlovak RepublicSloveniaSmall statesSolomon IslandsSouth AfricaSouth AsiaSouth Asia (IDA & IBRD)South SudanSpainSri LankaSt. LuciaSt. Vincent and the GrenadinesSub-Saharan Africa Sub-Saharan Africa (excluding high income)Sub-Saharan Africa (IDA & IBRD countries)SudanSurinameSwazilandSwedenSwitzerlandSyrian Arab RepublicTajikistanTanzaniaThailandTimor-LesteTogoTongaTrinidad and TobagoTunisiaTurkeyTurkmenistanUgandaUkraineUnited Arab EmiratesUnited KingdomUnited StatesUpper middle incomeUruguayUzbekistanVanuatuVenezuela, RBVietnamWorldYemen, Rep.ZambiaZimbabwe Timeline:
This timeline shows a graph from 1981 to 2016 of Chad. No data until 1980. Number of actual observations by date: 36.
Source name:
World Development Indicators
Source organization:
Estimates based on sources and methods described in "The Changing Wealth of Nations: Measuring Sustainable Development in the New Millennium" (World Bank, 2011).
Categories, topics:
Energy & Mining, Environment
Last updated:
apr 23, 2017
Indicators value changes by year
Maximum:
38.744
jan 1, 2005
At the date of observation
Value
Absolute change
Change from previous value
jan 1, 1981
10.078
+10.078
0.0%
jan 1, 1982
10.371
+0.292
2.9%
jan 1, 1983
14.627
+4.256
41.04%
jan 1, 1984
10.034
-4.593
-31.4%
jan 1, 1985
8.313
-1.721
-17.15%
jan 1, 1986
5.73
-2.583
-31.07%
jan 1, 1987
8.601
+2.871
50.1%
jan 1, 1988
7.904
-0.697
-8.1%
jan 1, 1989
6.586
-1.318
-16.67%
jan 1, 1990
7.076
+0.49
7.43%
jan 1, 1991
7.517
+0.442
6.24%
jan 1, 1992
6.911
-0.606
-8.07%
jan 1, 1993
7.231
+0.32
4.62%
jan 1, 1994
8.507
+1.276
17.65%
jan 1, 1995
12.199
+3.692
43.4%
jan 1, 1996
14.216
+2.018
16.54%
jan 1, 1997
12.728
-1.489
-10.47%
jan 1, 1998
12.455
-0.273
-2.14%
jan 1, 1999
11.626
-0.83
-6.66%
jan 1, 2000
9.5
-2.125
-18.28%
jan 1, 2001
10.593
+1.093
11.51%
jan 1, 2002
8.328
-2.266
-21.39%
jan 1, 2003
8.65
+0.322
3.87%
jan 1, 2004
14.542
+5.892
68.12%
jan 1, 2005
38.744
+24.202
166.43%
jan 1, 2006
38.647
-0.096
-0.25%
jan 1, 2007
36.218
-2.429
-6.29%
jan 1, 2008
34.024
-2.194
-6.06%
jan 1, 2009
35.669
+1.645
4.83%
jan 1, 2010
19.459
-16.21
-45.45%
jan 1, 2011
24.504
+5.045
25.93%
jan 1, 2012
32.321
+7.817
31.9%
jan 1, 2013
29.945
-2.377
-7.35%
jan 1, 2014
23.93
-6.015
-20.09%
jan 1, 2015
20.916
-3.014
-12.6%
jan 1, 2016
13.077
-7.839
-37.48%
Ranking of countries by current statistics by years


Comments: