29
/
en
AIzaSyAYiBZKx7MnpbEhh9jyipgxe19OcubqV5w
April 1, 2024
159024
Iraq
IRQ
true
2
1
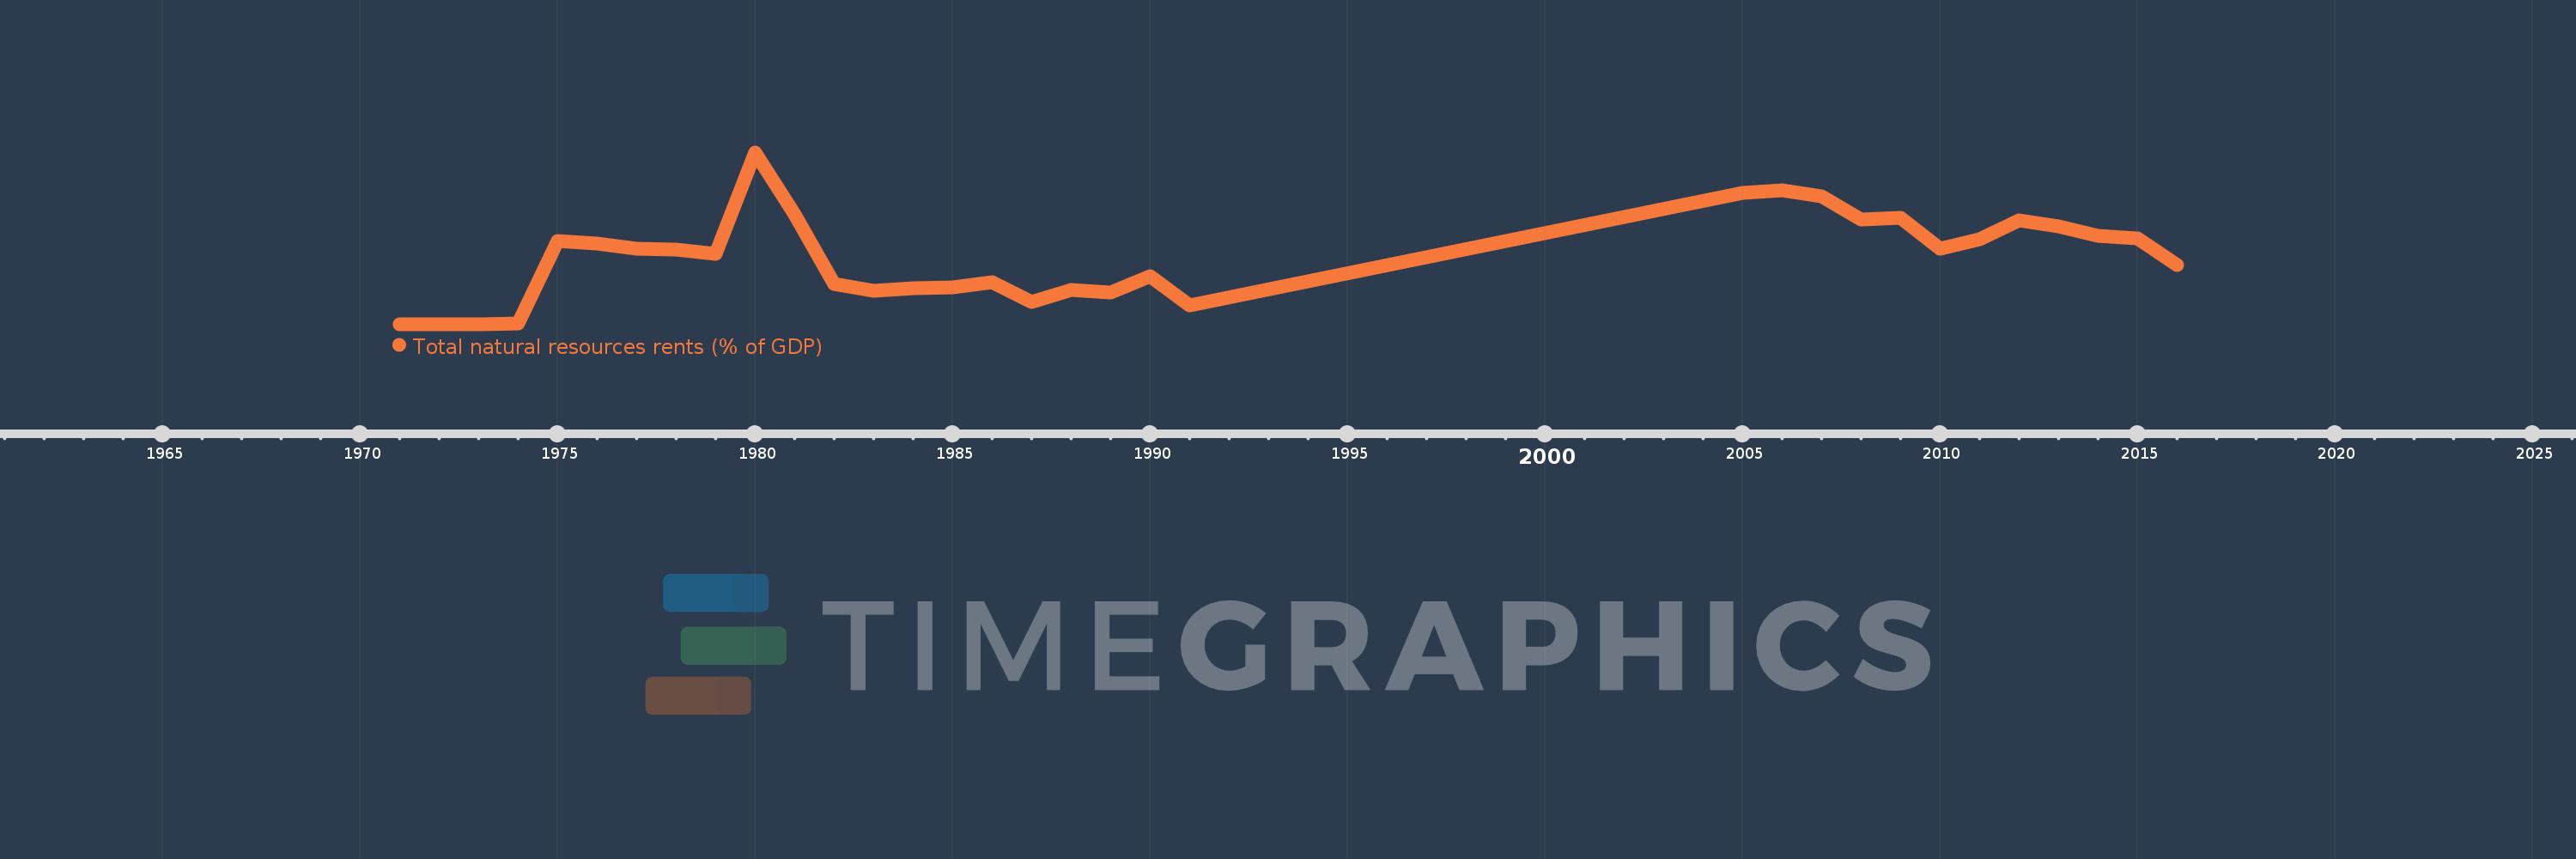
Total natural resources rents (% of GDP)
2016,2015,2014,2013,2012,2011,2010,2009,2008,2007,2006,2005,1991,1990,1989,1988,1987,1986,1985,1984,1983,1982,1981,1980,1979,1978,1977,1976,1975,1974,1973,1972,1971
This statistics in other country:
AfghanistanAlbaniaAlgeriaAngolaArab WorldArgentinaArmeniaArubaAustraliaAustriaAzerbaijanBahamas, TheBahrainBangladeshBarbadosBelarusBelgiumBelizeBeninBhutanBoliviaBosnia and HerzegovinaBotswanaBrazilBrunei DarussalamBulgariaBurkina FasoBurundiCabo VerdeCambodiaCameroonCanadaCaribbean small statesCentral African RepublicCentral Europe and the BalticsChadChileChinaColombiaComorosCongo, Dem. Rep.Congo, Rep.Costa RicaCote d'IvoireCroatiaCubaCyprusCzech RepublicDenmarkDjiboutiDominicaDominican RepublicEarly-demographic dividendEast Asia & PacificEast Asia & Pacific (excluding high income)East Asia & Pacific (IDA & IBRD countries)EcuadorEgypt, Arab Rep.El SalvadorEquatorial GuineaEritreaEstoniaEthiopiaEuro areaEurope & Central AsiaEurope & Central Asia (excluding high income)Europe & Central Asia (IDA & IBRD countries)European UnionFijiFinlandFragile and conflict affected situationsFranceFrench PolynesiaGabonGambia, TheGeorgiaGermanyGhanaGreeceGuatemalaGuineaGuinea-BissauGuyanaHaitiHeavily indebted poor countries (HIPC)High incomeHondurasHong Kong SAR, ChinaHungaryIBRD onlyIcelandIDA & IBRD totalIDA blendIDA onlyIDA totalIndiaIndonesiaIran, Islamic Rep.IraqIrelandIsraelItalyJamaicaJapanJordanKazakhstanKenyaKiribatiKorea, Rep.KuwaitKyrgyz RepublicLao PDRLate-demographic dividendLatin America & Caribbean Latin America & Caribbean (excluding high income)Latin America & the Caribbean (IDA & IBRD countries)LatviaLeast developed countries: UN classificationLebanonLesothoLiberiaLibyaLithuaniaLow & middle incomeLow incomeLower middle incomeLuxembourgMacao SAR, ChinaMacedonia, FYRMadagascarMalawiMalaysiaMaldivesMaliMaltaMauritaniaMauritiusMexicoMiddle East & North AfricaMiddle East & North Africa (excluding high income)Middle East & North Africa (IDA & IBRD countries)Middle incomeMoldovaMongoliaMontenegroMoroccoMozambiqueMyanmarNamibiaNepalNetherlandsNew CaledoniaNew ZealandNicaraguaNigerNigeriaNorth AmericaNorwayOECD membersOmanOther small statesPacific island small statesPakistanPanamaPapua New GuineaParaguayPeruPhilippinesPolandPortugalPost-demographic dividendPre-demographic dividendQatarRomaniaRussian FederationRwandaSamoaSao Tome and PrincipeSaudi ArabiaSenegalSerbiaSeychellesSierra LeoneSingaporeSlovak RepublicSloveniaSmall statesSolomon IslandsSouth AfricaSouth AsiaSouth Asia (IDA & IBRD)South SudanSpainSri LankaSt. LuciaSt. Vincent and the GrenadinesSub-Saharan Africa Sub-Saharan Africa (excluding high income)Sub-Saharan Africa (IDA & IBRD countries)SudanSurinameSwazilandSwedenSwitzerlandSyrian Arab RepublicTajikistanTanzaniaThailandTimor-LesteTogoTongaTrinidad and TobagoTunisiaTurkeyTurkmenistanUgandaUkraineUnited Arab EmiratesUnited KingdomUnited StatesUpper middle incomeUruguayUzbekistanVanuatuVenezuela, RBVietnamWorldYemen, Rep.ZambiaZimbabwe Timeline:
This timeline shows a graph from 1971 to 2016 of Iraq. No data until 1970. Number of actual observations by date: 33.
Source name:
World Development Indicators
Source organization:
Estimates based on sources and methods described in "The Changing Wealth of Nations: Measuring Sustainable Development in the New Millennium" (World Bank, 2011).
Categories, topics:
Energy & Mining, Environment
Last updated:
apr 23, 2017
Indicators value changes by year
Maximum:
82.618
jan 1, 1980
At the date of observation
Value
Absolute change
Change from previous value
jan 1, 1971
0.108
+0.108
0.0%
jan 1, 1972
0.11
+0.001
1.22%
jan 1, 1973
0.153
+0.043
39.64%
jan 1, 1974
0.563
+0.41
267.65%
jan 1, 1975
40.021
+39.458
7.01K%
jan 1, 1976
38.8
-1.22
-3.05%
jan 1, 1977
36.401
-2.399
-6.18%
jan 1, 1978
36.089
-0.312
-0.86%
jan 1, 1979
34.061
-2.028
-5.62%
jan 1, 1980
82.618
+48.557
142.56%
jan 1, 1981
52.839
-29.779
-36.04%
jan 1, 1982
19.651
-33.188
-62.81%
jan 1, 1983
16.111
-3.54
-18.01%
jan 1, 1984
17.58
+1.468
9.11%
jan 1, 1985
17.744
+0.164
0.94%
jan 1, 1986
20.242
+2.498
14.08%
jan 1, 1987
10.682
-9.561
-47.23%
jan 1, 1988
16.617
+5.936
55.57%
jan 1, 1989
15.484
-1.133
-6.82%
jan 1, 1990
23.294
+7.81
50.44%
jan 1, 1991
9.033
-14.261
-61.22%
jan 1, 2005
63.307
+54.273
600.82%
jan 1, 2006
64.405
+1.099
1.74%
jan 1, 2007
61.606
-2.799
-4.35%
jan 1, 2008
50.566
-11.04
-17.92%
jan 1, 2009
51.424
+0.857
1.7%
jan 1, 2010
36.318
-15.106
-29.38%
jan 1, 2011
40.87
+4.553
12.54%
jan 1, 2012
49.98
+9.11
22.29%
jan 1, 2013
47.243
-2.737
-5.48%
jan 1, 2014
42.505
-4.739
-10.03%
jan 1, 2015
41.263
-1.241
-2.92%
jan 1, 2016
28.642
-12.621
-30.59%
Ranking of countries by current statistics by years


Comments: