29
/
en
AIzaSyAYiBZKx7MnpbEhh9jyipgxe19OcubqV5w
April 1, 2024
221657
Paraguay
PRY
true
2
1
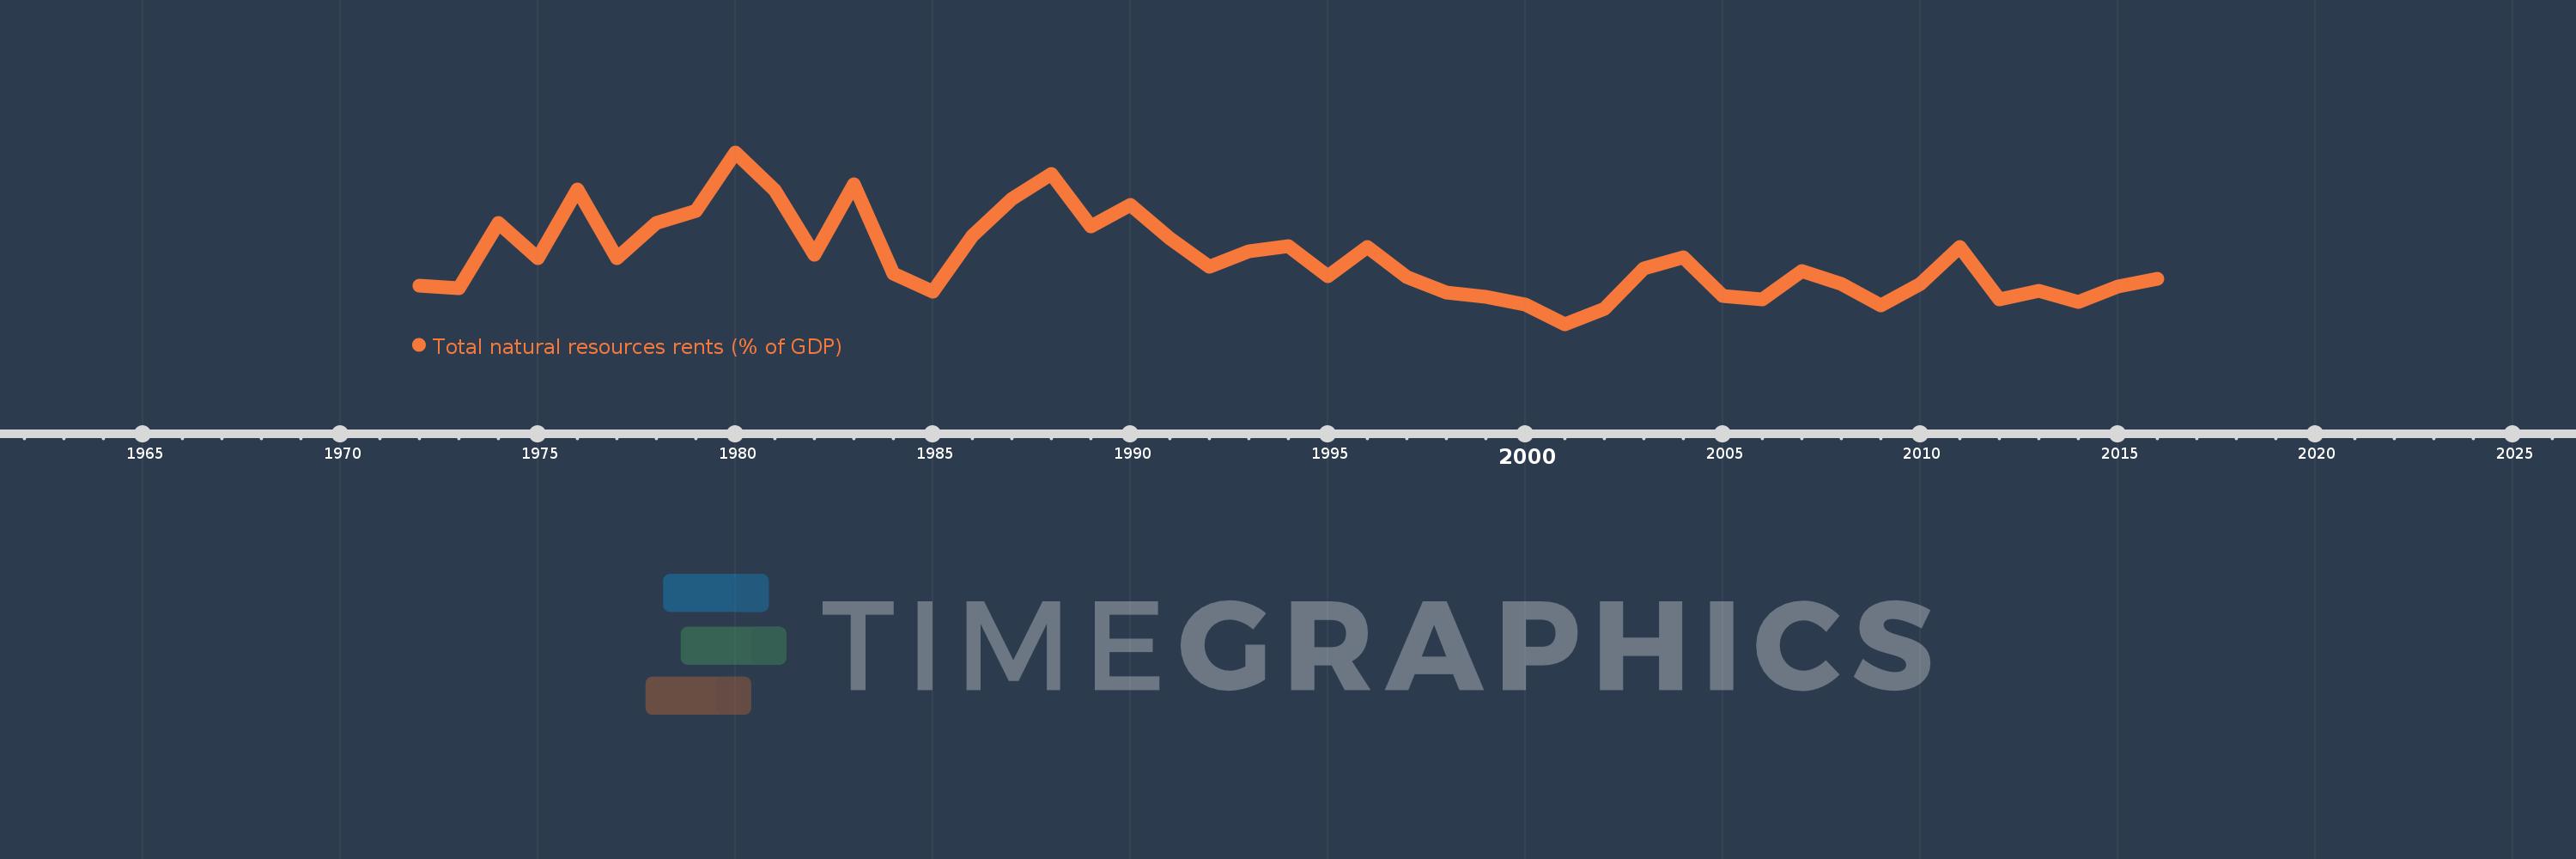
Total natural resources rents (% of GDP)
2016,2015,2014,2013,2012,2011,2010,2009,2008,2007,2006,2005,2004,2003,2002,2001,2000,1999,1998,1997,1996,1995,1994,1993,1992,1991,1990,1989,1988,1987,1986,1985,1984,1983,1982,1981,1980,1979,1978,1977,1976,1975,1974,1973,1972
This statistics in other country:
AfghanistanAlbaniaAlgeriaAngolaArab WorldArgentinaArmeniaArubaAustraliaAustriaAzerbaijanBahamas, TheBahrainBangladeshBarbadosBelarusBelgiumBelizeBeninBhutanBoliviaBosnia and HerzegovinaBotswanaBrazilBrunei DarussalamBulgariaBurkina FasoBurundiCabo VerdeCambodiaCameroonCanadaCaribbean small statesCentral African RepublicCentral Europe and the BalticsChadChileChinaColombiaComorosCongo, Dem. Rep.Congo, Rep.Costa RicaCote d'IvoireCroatiaCubaCyprusCzech RepublicDenmarkDjiboutiDominicaDominican RepublicEarly-demographic dividendEast Asia & PacificEast Asia & Pacific (excluding high income)East Asia & Pacific (IDA & IBRD countries)EcuadorEgypt, Arab Rep.El SalvadorEquatorial GuineaEritreaEstoniaEthiopiaEuro areaEurope & Central AsiaEurope & Central Asia (excluding high income)Europe & Central Asia (IDA & IBRD countries)European UnionFijiFinlandFragile and conflict affected situationsFranceFrench PolynesiaGabonGambia, TheGeorgiaGermanyGhanaGreeceGuatemalaGuineaGuinea-BissauGuyanaHaitiHeavily indebted poor countries (HIPC)High incomeHondurasHong Kong SAR, ChinaHungaryIBRD onlyIcelandIDA & IBRD totalIDA blendIDA onlyIDA totalIndiaIndonesiaIran, Islamic Rep.IraqIrelandIsraelItalyJamaicaJapanJordanKazakhstanKenyaKiribatiKorea, Rep.KuwaitKyrgyz RepublicLao PDRLate-demographic dividendLatin America & Caribbean Latin America & Caribbean (excluding high income)Latin America & the Caribbean (IDA & IBRD countries)LatviaLeast developed countries: UN classificationLebanonLesothoLiberiaLibyaLithuaniaLow & middle incomeLow incomeLower middle incomeLuxembourgMacao SAR, ChinaMacedonia, FYRMadagascarMalawiMalaysiaMaldivesMaliMaltaMauritaniaMauritiusMexicoMiddle East & North AfricaMiddle East & North Africa (excluding high income)Middle East & North Africa (IDA & IBRD countries)Middle incomeMoldovaMongoliaMontenegroMoroccoMozambiqueMyanmarNamibiaNepalNetherlandsNew CaledoniaNew ZealandNicaraguaNigerNigeriaNorth AmericaNorwayOECD membersOmanOther small statesPacific island small statesPakistanPanamaPapua New GuineaParaguayPeruPhilippinesPolandPortugalPost-demographic dividendPre-demographic dividendQatarRomaniaRussian FederationRwandaSamoaSao Tome and PrincipeSaudi ArabiaSenegalSerbiaSeychellesSierra LeoneSingaporeSlovak RepublicSloveniaSmall statesSolomon IslandsSouth AfricaSouth AsiaSouth Asia (IDA & IBRD)South SudanSpainSri LankaSt. LuciaSt. Vincent and the GrenadinesSub-Saharan Africa Sub-Saharan Africa (excluding high income)Sub-Saharan Africa (IDA & IBRD countries)SudanSurinameSwazilandSwedenSwitzerlandSyrian Arab RepublicTajikistanTanzaniaThailandTimor-LesteTogoTongaTrinidad and TobagoTunisiaTurkeyTurkmenistanUgandaUkraineUnited Arab EmiratesUnited KingdomUnited StatesUpper middle incomeUruguayUzbekistanVanuatuVenezuela, RBVietnamWorldYemen, Rep.ZambiaZimbabwe Timeline:
This timeline shows a graph from 1972 to 2016 of Paraguay. No data until 1971. Number of actual observations by date: 45.
Source name:
World Development Indicators
Source organization:
Estimates based on sources and methods described in "The Changing Wealth of Nations: Measuring Sustainable Development in the New Millennium" (World Bank, 2011).
Categories, topics:
Energy & Mining, Environment
Last updated:
apr 23, 2017
Indicators value changes by year
At the date of observation
Value
Absolute change
Change from previous value
jan 1, 1972
2.103
+2.103
0.0%
jan 1, 1973
2.076
-0.028
-1.31%
jan 1, 1974
2.972
+0.896
43.19%
jan 1, 1975
2.494
-0.479
-16.1%
jan 1, 1976
3.443
+0.95
38.09%
jan 1, 1977
2.491
-0.952
-27.65%
jan 1, 1978
2.975
+0.484
19.44%
jan 1, 1979
3.139
+0.164
5.51%
jan 1, 1980
3.951
+0.812
25.86%
jan 1, 1981
3.423
-0.528
-13.36%
jan 1, 1982
2.537
-0.886
-25.89%
jan 1, 1983
3.51
+0.973
38.37%
jan 1, 1984
2.279
-1.231
-35.06%
jan 1, 1985
2.024
-0.256
-11.22%
jan 1, 1986
2.794
+0.77
38.07%
jan 1, 1987
3.304
+0.51
18.26%
jan 1, 1988
3.647
+0.342
10.36%
jan 1, 1989
2.929
-0.718
-19.68%
jan 1, 1990
3.224
+0.295
10.06%
jan 1, 1991
2.757
-0.466
-14.46%
jan 1, 1992
2.372
-0.385
-13.96%
jan 1, 1993
2.58
+0.208
8.76%
jan 1, 1994
2.652
+0.072
2.78%
jan 1, 1995
2.245
-0.407
-15.36%
jan 1, 1996
2.64
+0.395
17.6%
jan 1, 1997
2.226
-0.414
-15.67%
jan 1, 1998
2.014
-0.212
-9.52%
jan 1, 1999
1.95
-0.064
-3.18%
jan 1, 2000
1.851
-0.099
-5.07%
jan 1, 2001
1.575
-0.276
-14.91%
jan 1, 2002
1.782
+0.207
13.15%
jan 1, 2003
2.344
+0.561
31.49%
jan 1, 2004
2.499
+0.155
6.63%
jan 1, 2005
1.964
-0.535
-21.4%
jan 1, 2006
1.924
-0.04
-2.04%
jan 1, 2007
2.305
+0.381
19.79%
jan 1, 2008
2.132
-0.173
-7.51%
jan 1, 2009
1.835
-0.297
-13.94%
jan 1, 2010
2.127
+0.293
15.96%
jan 1, 2011
2.639
+0.512
24.05%
jan 1, 2012
1.919
-0.72
-27.27%
jan 1, 2013
2.04
+0.121
6.31%
jan 1, 2014
1.877
-0.163
-7.99%
jan 1, 2015
2.092
+0.214
11.41%
jan 1, 2016
2.198
+0.106
5.07%
Ranking of countries by current statistics by years


Comments: