29
/
en
AIzaSyAYiBZKx7MnpbEhh9jyipgxe19OcubqV5w
April 1, 2024
58607
South Asia (IDA & IBRD)
TSA
false
2
1
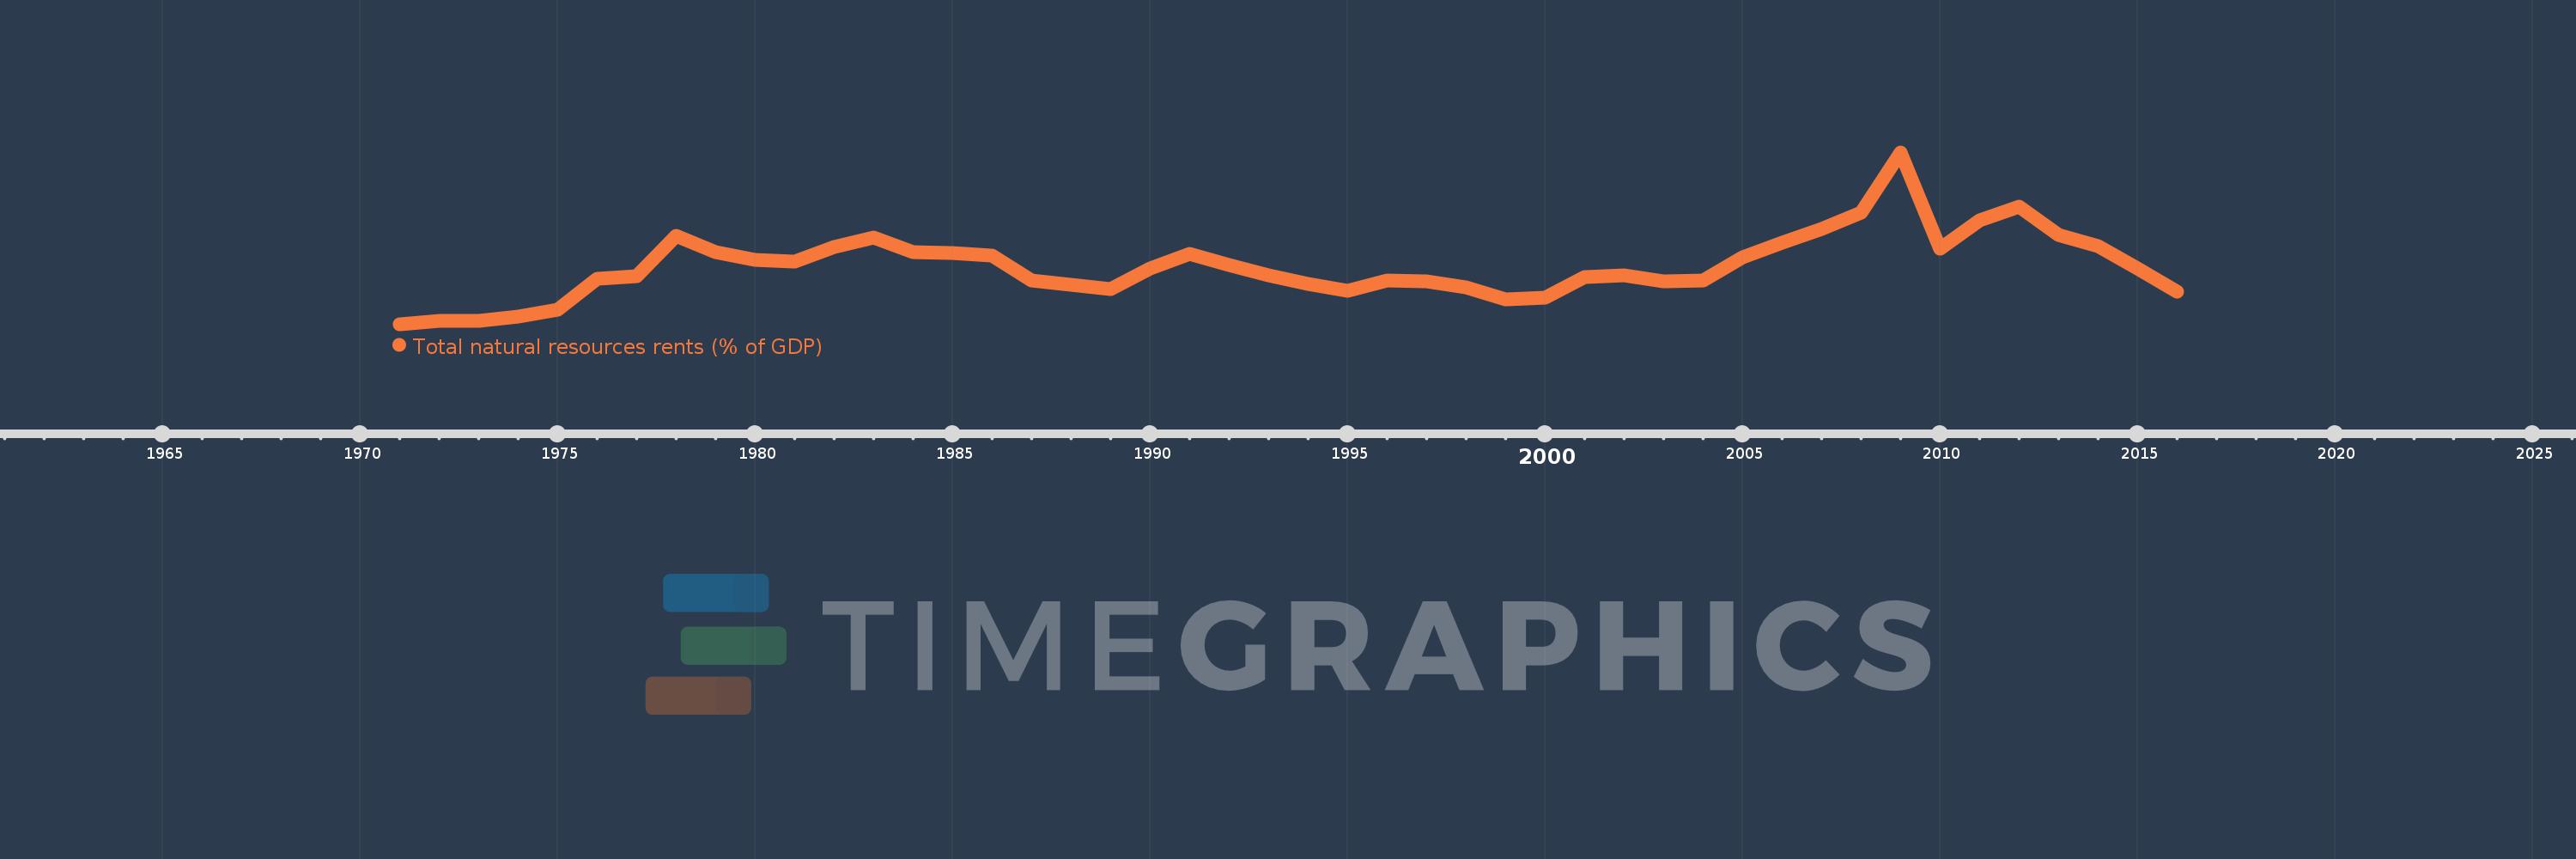
Total natural resources rents (% of GDP)
2016,2015,2014,2013,2012,2011,2010,2009,2008,2007,2006,2005,2004,2003,2002,2001,2000,1999,1998,1997,1996,1995,1994,1993,1992,1991,1990,1989,1988,1987,1986,1985,1984,1983,1982,1981,1980,1979,1978,1977,1976,1975,1974,1973,1972,1971
This statistics in other country:
AfghanistanAlbaniaAlgeriaAngolaArab WorldArgentinaArmeniaArubaAustraliaAustriaAzerbaijanBahamas, TheBahrainBangladeshBarbadosBelarusBelgiumBelizeBeninBhutanBoliviaBosnia and HerzegovinaBotswanaBrazilBrunei DarussalamBulgariaBurkina FasoBurundiCabo VerdeCambodiaCameroonCanadaCaribbean small statesCentral African RepublicCentral Europe and the BalticsChadChileChinaColombiaComorosCongo, Dem. Rep.Congo, Rep.Costa RicaCote d'IvoireCroatiaCubaCyprusCzech RepublicDenmarkDjiboutiDominicaDominican RepublicEarly-demographic dividendEast Asia & PacificEast Asia & Pacific (excluding high income)East Asia & Pacific (IDA & IBRD countries)EcuadorEgypt, Arab Rep.El SalvadorEquatorial GuineaEritreaEstoniaEthiopiaEuro areaEurope & Central AsiaEurope & Central Asia (excluding high income)Europe & Central Asia (IDA & IBRD countries)European UnionFijiFinlandFragile and conflict affected situationsFranceFrench PolynesiaGabonGambia, TheGeorgiaGermanyGhanaGreeceGuatemalaGuineaGuinea-BissauGuyanaHaitiHeavily indebted poor countries (HIPC)High incomeHondurasHong Kong SAR, ChinaHungaryIBRD onlyIcelandIDA & IBRD totalIDA blendIDA onlyIDA totalIndiaIndonesiaIran, Islamic Rep.IraqIrelandIsraelItalyJamaicaJapanJordanKazakhstanKenyaKiribatiKorea, Rep.KuwaitKyrgyz RepublicLao PDRLate-demographic dividendLatin America & Caribbean Latin America & Caribbean (excluding high income)Latin America & the Caribbean (IDA & IBRD countries)LatviaLeast developed countries: UN classificationLebanonLesothoLiberiaLibyaLithuaniaLow & middle incomeLow incomeLower middle incomeLuxembourgMacao SAR, ChinaMacedonia, FYRMadagascarMalawiMalaysiaMaldivesMaliMaltaMauritaniaMauritiusMexicoMiddle East & North AfricaMiddle East & North Africa (excluding high income)Middle East & North Africa (IDA & IBRD countries)Middle incomeMoldovaMongoliaMontenegroMoroccoMozambiqueMyanmarNamibiaNepalNetherlandsNew CaledoniaNew ZealandNicaraguaNigerNigeriaNorth AmericaNorwayOECD membersOmanOther small statesPacific island small statesPakistanPanamaPapua New GuineaParaguayPeruPhilippinesPolandPortugalPost-demographic dividendPre-demographic dividendQatarRomaniaRussian FederationRwandaSamoaSao Tome and PrincipeSaudi ArabiaSenegalSerbiaSeychellesSierra LeoneSingaporeSlovak RepublicSloveniaSmall statesSolomon IslandsSouth AfricaSouth AsiaSouth Asia (IDA & IBRD)South SudanSpainSri LankaSt. LuciaSt. Vincent and the GrenadinesSub-Saharan Africa Sub-Saharan Africa (excluding high income)Sub-Saharan Africa (IDA & IBRD countries)SudanSurinameSwazilandSwedenSwitzerlandSyrian Arab RepublicTajikistanTanzaniaThailandTimor-LesteTogoTongaTrinidad and TobagoTunisiaTurkeyTurkmenistanUgandaUkraineUnited Arab EmiratesUnited KingdomUnited StatesUpper middle incomeUruguayUzbekistanVanuatuVenezuela, RBVietnamWorldYemen, Rep.ZambiaZimbabwe Timeline:
This timeline shows a graph from 1971 to 2016 of South Asia (IDA & IBRD). No data until 1970. Number of actual observations by date: 46.
Source name:
World Development Indicators
Source organization:
Estimates based on sources and methods described in "The Changing Wealth of Nations: Measuring Sustainable Development in the New Millennium" (World Bank, 2011).
Categories, topics:
Energy & Mining, Environment
Last updated:
apr 23, 2017
Indicators value changes by year
At the date of observation
Value
Absolute change
Change from previous value
jan 1, 1971
0.576
+0.576
0.0%
jan 1, 1972
0.686
+0.11
19.05%
jan 1, 1973
0.697
+0.011
1.55%
jan 1, 1974
0.841
+0.144
20.73%
jan 1, 1975
1.059
+0.218
25.9%
jan 1, 1976
2.1
+1.041
98.34%
jan 1, 1977
2.199
+0.099
4.71%
jan 1, 1978
3.549
+1.35
61.4%
jan 1, 1979
3.011
-0.538
-15.15%
jan 1, 1980
2.726
-0.285
-9.46%
jan 1, 1981
2.673
-0.054
-1.97%
jan 1, 1982
3.182
+0.509
19.06%
jan 1, 1983
3.48
+0.298
9.35%
jan 1, 1984
3.005
-0.475
-13.64%
jan 1, 1985
2.965
-0.04
-1.34%
jan 1, 1986
2.897
-0.068
-2.3%
jan 1, 1987
2.057
-0.839
-28.97%
jan 1, 1988
1.892
-0.165
-8.02%
jan 1, 1989
1.743
-0.149
-7.89%
jan 1, 1990
2.438
+0.695
39.9%
jan 1, 1991
2.95
+0.512
20.98%
jan 1, 1992
2.575
-0.375
-12.71%
jan 1, 1993
2.207
-0.368
-14.31%
jan 1, 1994
1.934
-0.273
-12.37%
jan 1, 1995
1.71
-0.223
-11.56%
jan 1, 1996
2.049
+0.339
19.83%
jan 1, 1997
2.017
-0.032
-1.57%
jan 1, 1998
1.823
-0.194
-9.61%
jan 1, 1999
1.42
-0.404
-22.13%
jan 1, 2000
1.466
+0.046
3.23%
jan 1, 2001
2.147
+0.681
46.47%
jan 1, 2002
2.221
+0.074
3.46%
jan 1, 2003
2.03
-0.19
-8.57%
jan 1, 2004
2.035
+0.005
0.24%
jan 1, 2005
2.811
+0.775
38.09%
jan 1, 2006
3.309
+0.498
17.73%
jan 1, 2007
3.767
+0.458
13.85%
jan 1, 2008
4.329
+0.562
14.92%
jan 1, 2009
6.35
+2.021
46.68%
jan 1, 2010
3.117
-3.233
-50.92%
jan 1, 2011
4.059
+0.943
30.25%
jan 1, 2012
4.533
+0.474
11.68%
jan 1, 2013
3.568
-0.965
-21.29%
jan 1, 2014
3.202
-0.366
-10.25%
jan 1, 2015
2.438
-0.764
-23.86%
jan 1, 2016
1.681
-0.757
-31.05%
Ranking of countries by current statistics by years


Comments: