29
/
en
AIzaSyAYiBZKx7MnpbEhh9jyipgxe19OcubqV5w
April 1, 2024
165643
Jordan
JOR
true
2
1
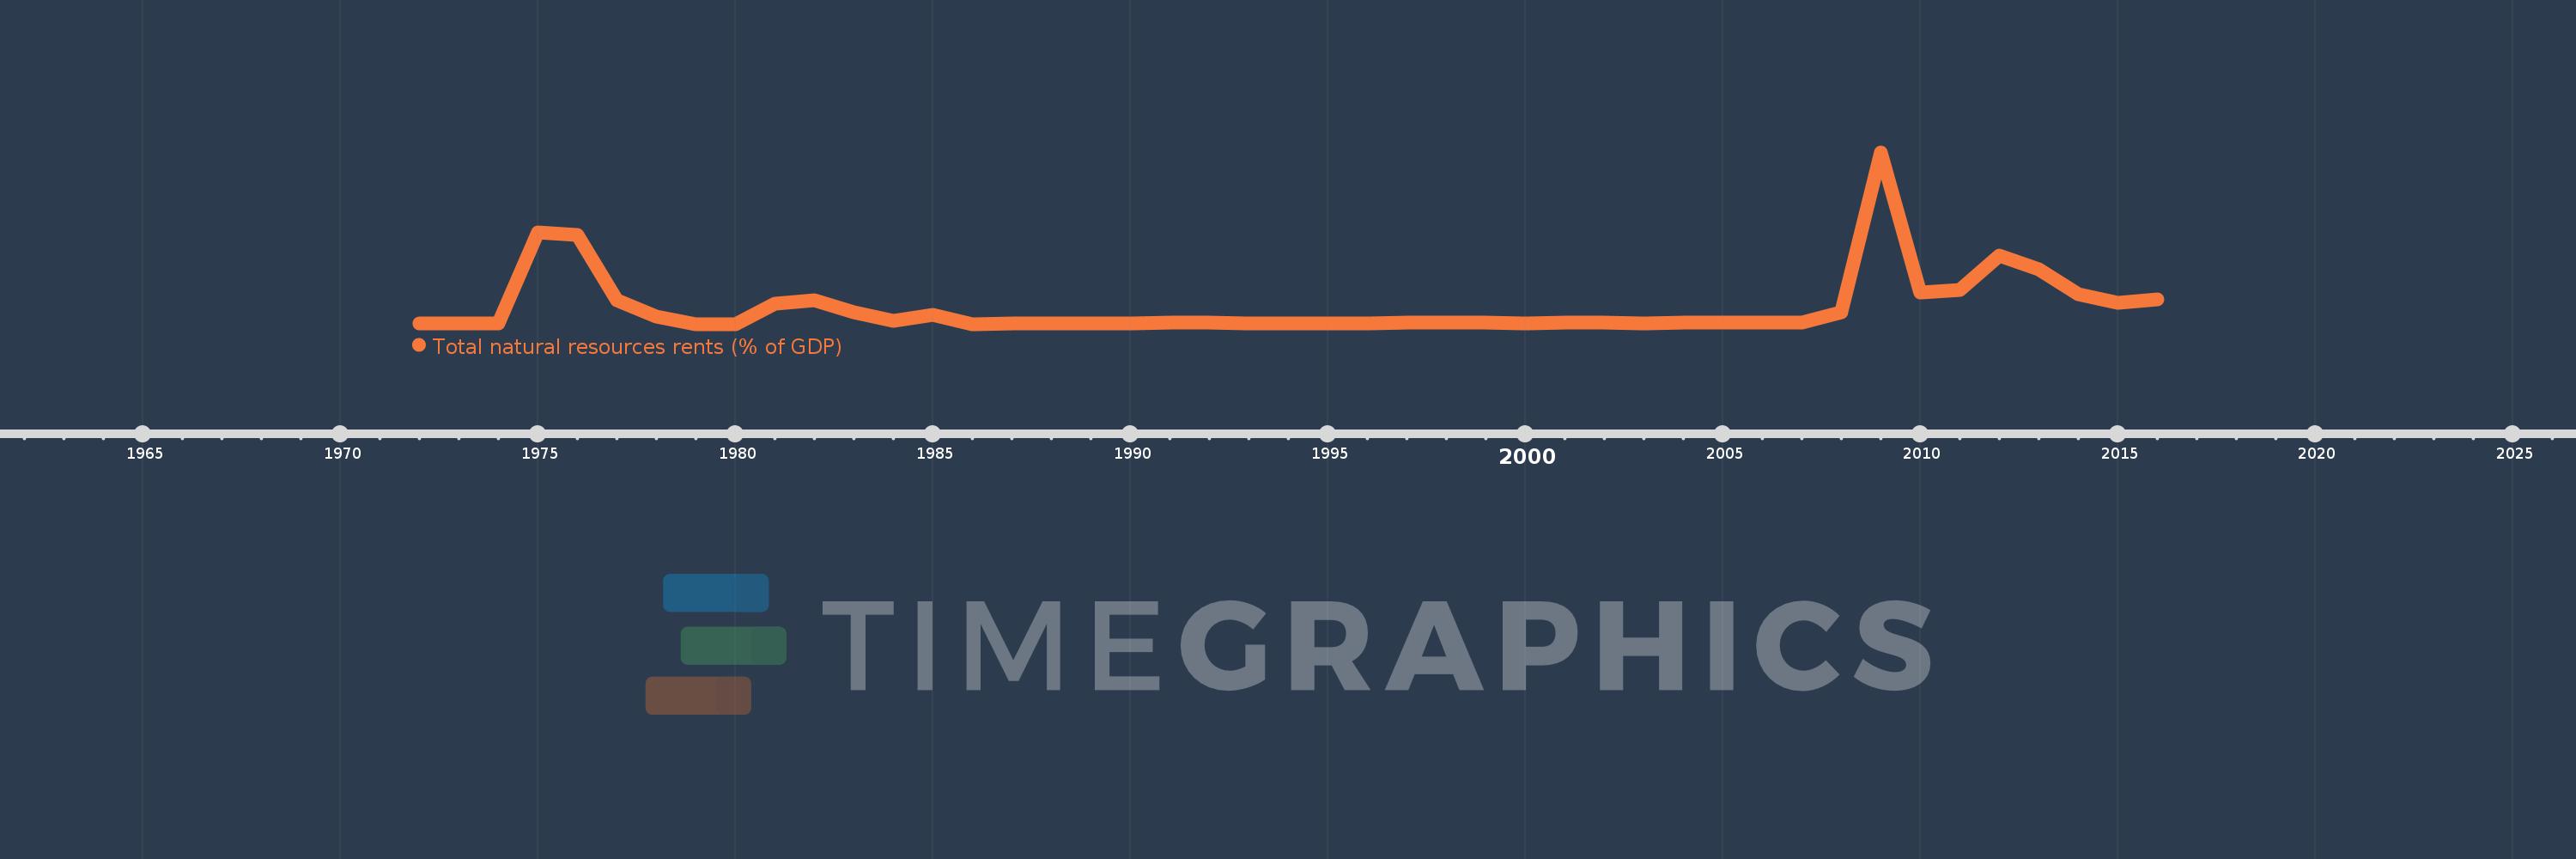
Total natural resources rents (% of GDP)
2016,2015,2014,2013,2012,2011,2010,2009,2008,2007,2006,2005,2004,2003,2002,2001,2000,1999,1998,1997,1996,1995,1994,1993,1992,1991,1990,1989,1988,1987,1986,1985,1984,1983,1982,1981,1980,1979,1978,1977,1976,1975,1974,1973,1972
This statistics in other country:
AfghanistanAlbaniaAlgeriaAngolaArab WorldArgentinaArmeniaArubaAustraliaAustriaAzerbaijanBahamas, TheBahrainBangladeshBarbadosBelarusBelgiumBelizeBeninBhutanBoliviaBosnia and HerzegovinaBotswanaBrazilBrunei DarussalamBulgariaBurkina FasoBurundiCabo VerdeCambodiaCameroonCanadaCaribbean small statesCentral African RepublicCentral Europe and the BalticsChadChileChinaColombiaComorosCongo, Dem. Rep.Congo, Rep.Costa RicaCote d'IvoireCroatiaCubaCyprusCzech RepublicDenmarkDjiboutiDominicaDominican RepublicEarly-demographic dividendEast Asia & PacificEast Asia & Pacific (excluding high income)East Asia & Pacific (IDA & IBRD countries)EcuadorEgypt, Arab Rep.El SalvadorEquatorial GuineaEritreaEstoniaEthiopiaEuro areaEurope & Central AsiaEurope & Central Asia (excluding high income)Europe & Central Asia (IDA & IBRD countries)European UnionFijiFinlandFragile and conflict affected situationsFranceFrench PolynesiaGabonGambia, TheGeorgiaGermanyGhanaGreeceGuatemalaGuineaGuinea-BissauGuyanaHaitiHeavily indebted poor countries (HIPC)High incomeHondurasHong Kong SAR, ChinaHungaryIBRD onlyIcelandIDA & IBRD totalIDA blendIDA onlyIDA totalIndiaIndonesiaIran, Islamic Rep.IraqIrelandIsraelItalyJamaicaJapanJordanKazakhstanKenyaKiribatiKorea, Rep.KuwaitKyrgyz RepublicLao PDRLate-demographic dividendLatin America & Caribbean Latin America & Caribbean (excluding high income)Latin America & the Caribbean (IDA & IBRD countries)LatviaLeast developed countries: UN classificationLebanonLesothoLiberiaLibyaLithuaniaLow & middle incomeLow incomeLower middle incomeLuxembourgMacao SAR, ChinaMacedonia, FYRMadagascarMalawiMalaysiaMaldivesMaliMaltaMauritaniaMauritiusMexicoMiddle East & North AfricaMiddle East & North Africa (excluding high income)Middle East & North Africa (IDA & IBRD countries)Middle incomeMoldovaMongoliaMontenegroMoroccoMozambiqueMyanmarNamibiaNepalNetherlandsNew CaledoniaNew ZealandNicaraguaNigerNigeriaNorth AmericaNorwayOECD membersOmanOther small statesPacific island small statesPakistanPanamaPapua New GuineaParaguayPeruPhilippinesPolandPortugalPost-demographic dividendPre-demographic dividendQatarRomaniaRussian FederationRwandaSamoaSao Tome and PrincipeSaudi ArabiaSenegalSerbiaSeychellesSierra LeoneSingaporeSlovak RepublicSloveniaSmall statesSolomon IslandsSouth AfricaSouth AsiaSouth Asia (IDA & IBRD)South SudanSpainSri LankaSt. LuciaSt. Vincent and the GrenadinesSub-Saharan Africa Sub-Saharan Africa (excluding high income)Sub-Saharan Africa (IDA & IBRD countries)SudanSurinameSwazilandSwedenSwitzerlandSyrian Arab RepublicTajikistanTanzaniaThailandTimor-LesteTogoTongaTrinidad and TobagoTunisiaTurkeyTurkmenistanUgandaUkraineUnited Arab EmiratesUnited KingdomUnited StatesUpper middle incomeUruguayUzbekistanVanuatuVenezuela, RBVietnamWorldYemen, Rep.ZambiaZimbabwe Timeline:
This timeline shows a graph from 1972 to 2016 of Jordan. No data until 1971. Number of actual observations by date: 45.
Source name:
World Development Indicators
Source organization:
Estimates based on sources and methods described in "The Changing Wealth of Nations: Measuring Sustainable Development in the New Millennium" (World Bank, 2011).
Categories, topics:
Energy & Mining, Environment
Last updated:
apr 23, 2017
Indicators value changes by year
At the date of observation
Value
Absolute change
Change from previous value
jan 1, 1972
0.037
+0.037
0.0%
jan 1, 1973
0.031
-0.006
-16.38%
jan 1, 1974
0.035
+0.004
12.25%
jan 1, 1975
4.404
+4.369
12.54K%
jan 1, 1976
4.31
-0.094
-2.14%
jan 1, 1977
1.172
-3.138
-72.8%
jan 1, 1978
0.394
-0.778
-66.35%
jan 1, 1979
0.027
-0.367
-93.08%
jan 1, 1980
0.02
-0.007
-25.13%
jan 1, 1981
1.01
+0.99
4.85K%
jan 1, 1982
1.167
+0.156
15.47%
jan 1, 1983
0.595
-0.571
-48.98%
jan 1, 1984
0.161
-0.435
-73.04%
jan 1, 1985
0.468
+0.307
191.57%
jan 1, 1986
0.011
-0.457
-97.57%
jan 1, 1987
0.037
+0.026
229.12%
jan 1, 1988
0.051
+0.013
35.11%
jan 1, 1989
0.043
-0.007
-14.44%
jan 1, 1990
0.057
+0.013
31.01%
jan 1, 1991
0.086
+0.029
51.25%
jan 1, 1992
0.082
-0.004
-4.69%
jan 1, 1993
0.06
-0.022
-27.32%
jan 1, 1994
0.054
-0.005
-9.14%
jan 1, 1995
0.058
+0.004
7.23%
jan 1, 1996
0.067
+0.009
15.48%
jan 1, 1997
0.074
+0.007
10.72%
jan 1, 1998
0.074
+0.0
0.16%
jan 1, 1999
0.077
+0.003
4.31%
jan 1, 2000
0.05
-0.027
-35.22%
jan 1, 2001
0.069
+0.019
37.86%
jan 1, 2002
0.079
+0.009
13.58%
jan 1, 2003
0.06
-0.018
-23.41%
jan 1, 2004
0.071
+0.011
18.8%
jan 1, 2005
0.071
0.0
-0.65%
jan 1, 2006
0.083
+0.012
17.31%
jan 1, 2007
0.094
+0.011
12.88%
jan 1, 2008
0.596
+0.502
534.1%
jan 1, 2009
8.253
+7.657
1.28K%
jan 1, 2010
1.54
-6.713
-81.34%
jan 1, 2011
1.672
+0.132
8.57%
jan 1, 2012
3.291
+1.618
96.78%
jan 1, 2013
2.634
-0.657
-19.95%
jan 1, 2014
1.467
-1.168
-44.32%
jan 1, 2015
1.053
-0.413
-28.19%
jan 1, 2016
1.186
+0.133
12.63%
Ranking of countries by current statistics by years


Comments: