29
/
en
AIzaSyAYiBZKx7MnpbEhh9jyipgxe19OcubqV5w
April 1, 2024
97130
Cabo Verde
CPV
true
2
1
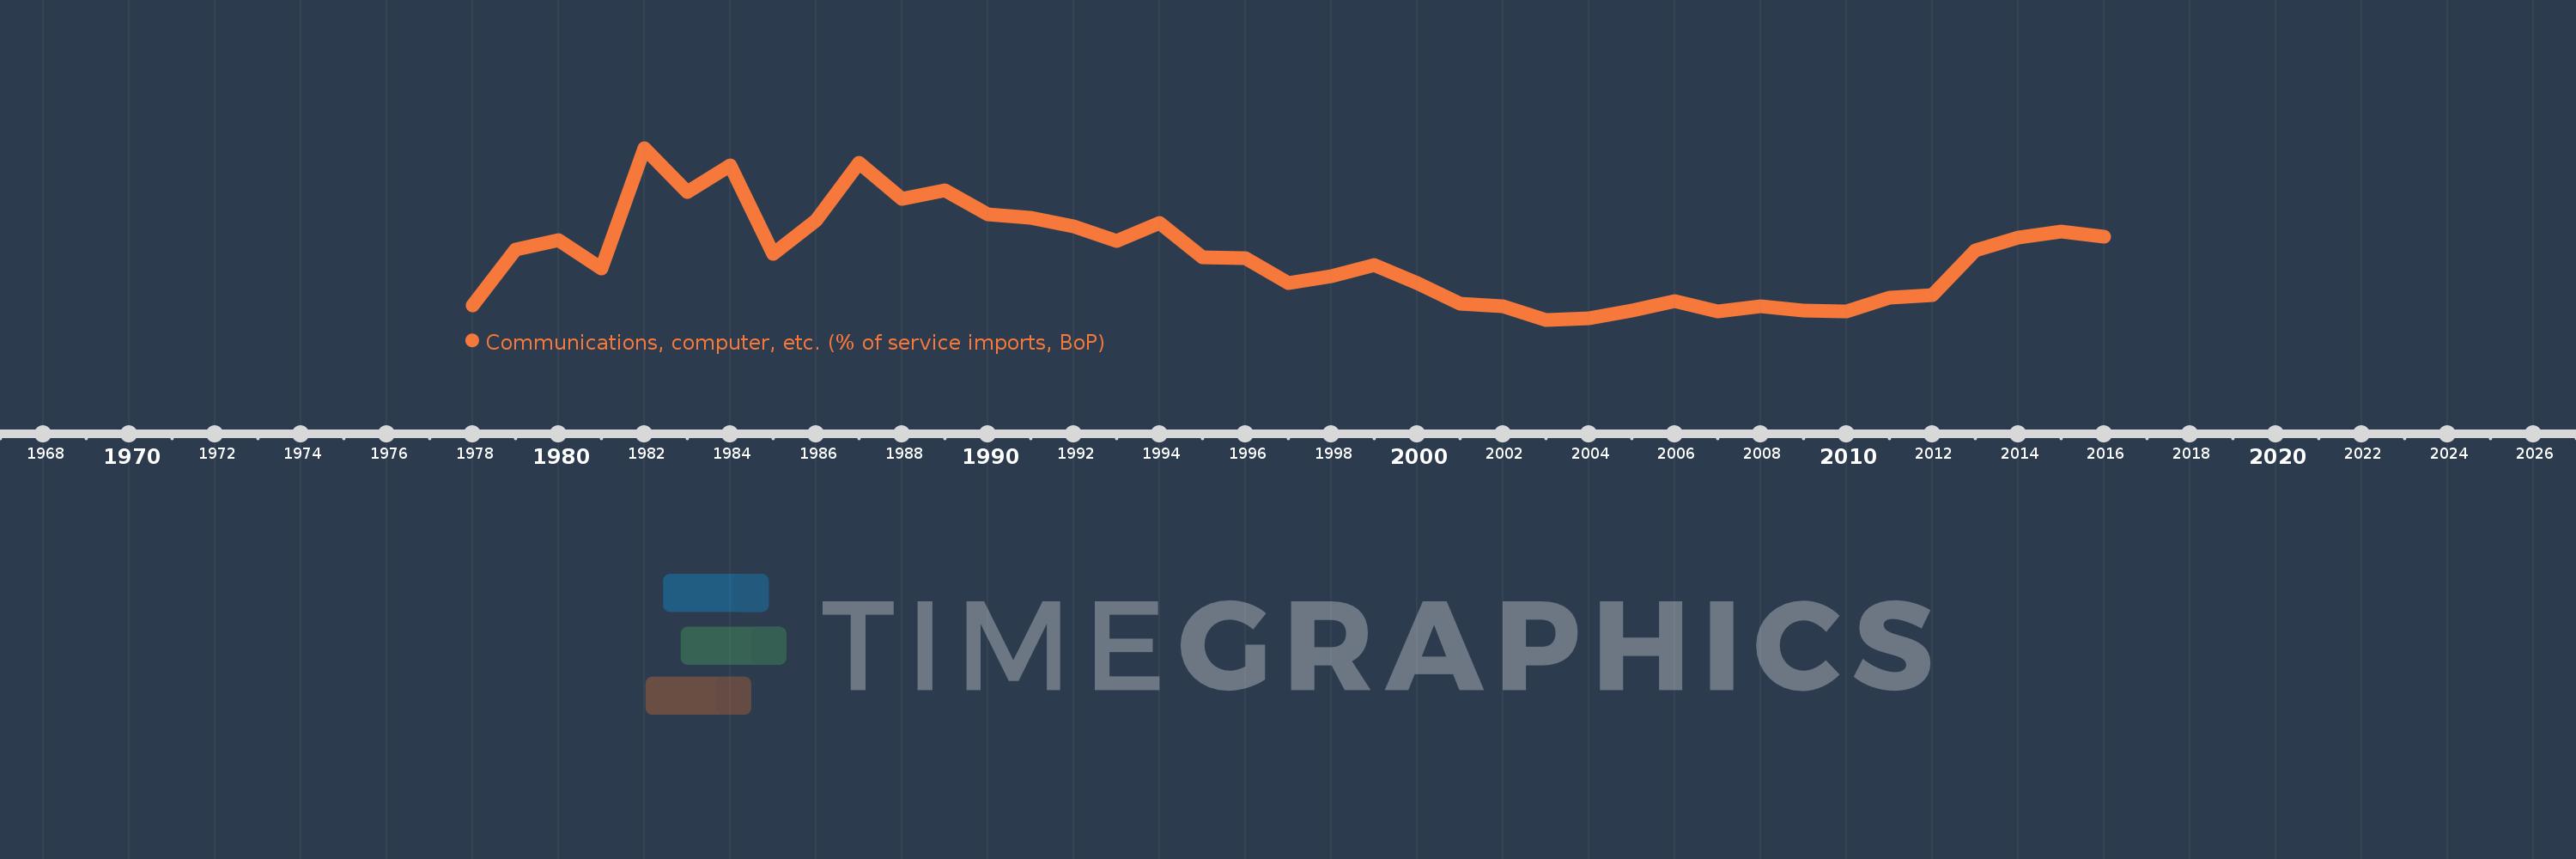
Communications, computer, etc. (% of service imports, BoP)
2016,2015,2014,2013,2012,2011,2010,2009,2008,2007,2006,2005,2004,2003,2002,2001,2000,1999,1998,1997,1996,1995,1994,1993,1992,1991,1990,1989,1988,1987,1986,1985,1984,1983,1982,1981,1980,1979,1978
This statistics in other country:
AfghanistanAlbaniaAlgeriaAngolaAntigua and BarbudaArab WorldArgentinaArmeniaArubaAustraliaAustriaAzerbaijanBahamas, TheBahrainBangladeshBarbadosBelarusBelgiumBelizeBeninBermudaBhutanBoliviaBosnia and HerzegovinaBotswanaBrazilBrunei DarussalamBulgariaBurkina FasoBurundiCabo VerdeCambodiaCameroonCanadaCaribbean small statesCentral African RepublicCentral Europe and the BalticsChadChileChinaColombiaComorosCongo, Dem. Rep.Congo, Rep.Costa RicaCote d'IvoireCroatiaCuracaoCyprusCzech RepublicDenmarkDjiboutiDominicaDominican RepublicEarly-demographic dividendEast Asia & PacificEast Asia & Pacific (excluding high income)East Asia & Pacific (IDA & IBRD countries)EcuadorEgypt, Arab Rep.El SalvadorEquatorial GuineaEritreaEstoniaEthiopiaEuro areaEurope & Central AsiaEurope & Central Asia (excluding high income)Europe & Central Asia (IDA & IBRD countries)European UnionFaroe IslandsFijiFinlandFragile and conflict affected situationsFranceFrench PolynesiaGabonGambia, TheGeorgiaGermanyGhanaGreeceGrenadaGuatemalaGuineaGuinea-BissauGuyanaHaitiHeavily indebted poor countries (HIPC)High incomeHondurasHong Kong SAR, ChinaHungaryIBRD onlyIcelandIDA & IBRD totalIDA onlyIDA totalIndiaIndonesiaIran, Islamic Rep.IraqIrelandIsraelItalyJamaicaJapanJordanKazakhstanKenyaKiribatiKorea, Rep.KosovoKuwaitKyrgyz RepublicLao PDRLate-demographic dividendLatin America & Caribbean Latin America & Caribbean (excluding high income)Latin America & the Caribbean (IDA & IBRD countries)LatviaLeast developed countries: UN classificationLebanonLesothoLiberiaLibyaLithuaniaLow & middle incomeLow incomeLower middle incomeLuxembourgMacao SAR, ChinaMacedonia, FYRMadagascarMalawiMalaysiaMaldivesMaliMaltaMarshall IslandsMauritaniaMauritiusMexicoMicronesia, Fed. Sts.Middle East & North AfricaMiddle East & North Africa (excluding high income)Middle East & North Africa (IDA & IBRD countries)Middle incomeMoldovaMongoliaMontenegroMoroccoMozambiqueMyanmarNamibiaNepalNetherlandsNew CaledoniaNew ZealandNicaraguaNigerNigeriaNorth AmericaNorwayOECD membersOmanOther small statesPacific island small statesPakistanPalauPanamaPapua New GuineaParaguayPeruPhilippinesPolandPortugalPost-demographic dividendPre-demographic dividendQatarRomaniaRussian FederationRwandaSamoaSao Tome and PrincipeSaudi ArabiaSenegalSerbiaSeychellesSierra LeoneSingaporeSint Maarten (Dutch part)Slovak RepublicSloveniaSmall statesSolomon IslandsSouth AfricaSouth AsiaSouth Asia (IDA & IBRD)South SudanSpainSri LankaSt. Kitts and NevisSt. LuciaSt. Vincent and the GrenadinesSub-Saharan Africa Sub-Saharan Africa (excluding high income)Sub-Saharan Africa (IDA & IBRD countries)SudanSurinameSwazilandSwedenSwitzerlandSyrian Arab RepublicTajikistanTanzaniaThailandTimor-LesteTogoTongaTrinidad and TobagoTunisiaTurkeyTuvaluUgandaUkraineUnited KingdomUnited StatesUpper middle incomeUruguayVanuatuVenezuela, RBWest Bank and GazaWorldYemen, Rep.ZambiaZimbabwe Timeline:
This timeline shows a graph from 1978 to 2016 of Cabo Verde. No data until 1977. Number of actual observations by date: 39.
Source name:
World Development Indicators
Source organization:
International Monetary Fund, Balance of Payments Statistics Yearbook and data files.
Categories, topics:
Economy & Growth, Trade
Last updated:
apr 23, 2017
Indicators value changes by year
Minimum:
11.725
jan 1, 2003
Maximum:
67.213
jan 1, 1982
At the date of observation
Value
Absolute change
Change from previous value
jan 1, 1978
16.466
+16.466
0.0%
jan 1, 1979
34.268
+17.802
108.12%
jan 1, 1980
37.543
+3.274
9.56%
jan 1, 1981
28.291
-9.252
-24.64%
jan 1, 1982
67.213
+38.922
137.58%
jan 1, 1983
53.018
-14.195
-21.12%
jan 1, 1984
61.694
+8.676
16.36%
jan 1, 1985
32.98
-28.714
-46.54%
jan 1, 1986
43.8
+10.82
32.81%
jan 1, 1987
62.306
+18.506
42.25%
jan 1, 1988
50.807
-11.499
-18.46%
jan 1, 1989
53.473
+2.667
5.25%
jan 1, 1990
45.83
-7.643
-14.29%
jan 1, 1991
44.567
-1.263
-2.75%
jan 1, 1992
41.842
-2.726
-6.12%
jan 1, 1993
37.125
-4.717
-11.27%
jan 1, 1994
42.95
+5.825
15.69%
jan 1, 1995
31.768
-11.183
-26.04%
jan 1, 1996
31.592
-0.176
-0.55%
jan 1, 1997
23.433
-8.159
-25.82%
jan 1, 1998
25.784
+2.35
10.03%
jan 1, 1999
29.313
+3.529
13.69%
jan 1, 2000
23.487
-5.826
-19.87%
jan 1, 2001
16.842
-6.645
-28.29%
jan 1, 2002
15.993
-0.849
-5.04%
jan 1, 2003
11.725
-4.268
-26.69%
jan 1, 2004
12.331
+0.606
5.17%
jan 1, 2005
14.671
+2.34
18.98%
jan 1, 2006
17.742
+3.071
20.93%
jan 1, 2007
14.289
-3.452
-19.46%
jan 1, 2008
16.132
+1.843
12.9%
jan 1, 2009
14.626
-1.507
-9.34%
jan 1, 2010
14.323
-0.302
-2.07%
jan 1, 2011
18.863
+4.54
31.7%
jan 1, 2012
19.576
+0.713
3.78%
jan 1, 2013
34.113
+14.537
74.26%
jan 1, 2014
38.255
+4.142
12.14%
jan 1, 2015
40.161
+1.906
4.98%
jan 1, 2016
38.448
-1.713
-4.27%
Ranking of countries by current statistics by years


Comments: