29
/
en
AIzaSyAYiBZKx7MnpbEhh9jyipgxe19OcubqV5w
April 1, 2024
107009
Colombia
COL
true
2
1
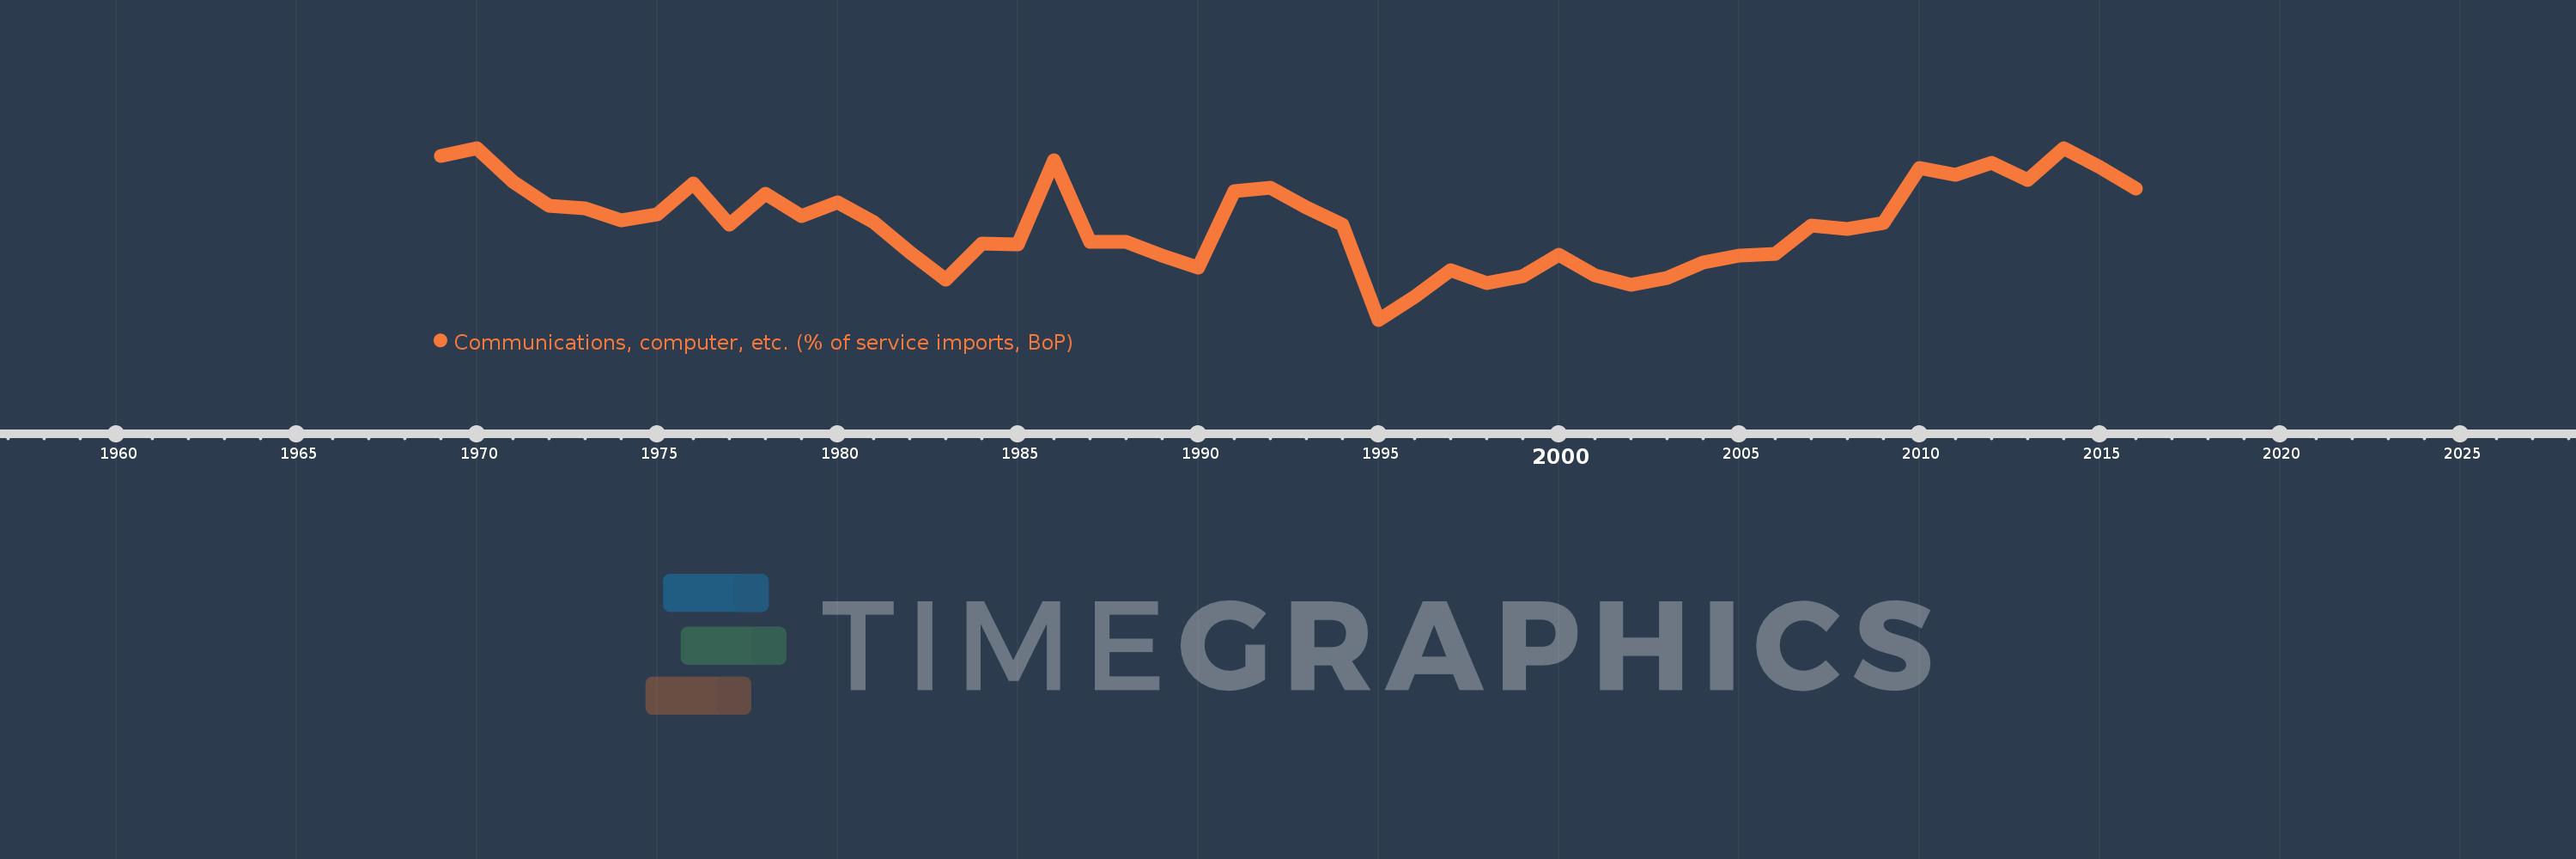
Communications, computer, etc. (% of service imports, BoP)
2016,2015,2014,2013,2012,2011,2010,2009,2008,2007,2006,2005,2004,2003,2002,2001,2000,1999,1998,1997,1996,1995,1994,1993,1992,1991,1990,1989,1988,1987,1986,1985,1984,1983,1982,1981,1980,1979,1978,1977,1976,1975,1974,1973,1972,1971,1970,1969
This statistics in other country:
AfghanistanAlbaniaAlgeriaAngolaAntigua and BarbudaArab WorldArgentinaArmeniaArubaAustraliaAustriaAzerbaijanBahamas, TheBahrainBangladeshBarbadosBelarusBelgiumBelizeBeninBermudaBhutanBoliviaBosnia and HerzegovinaBotswanaBrazilBrunei DarussalamBulgariaBurkina FasoBurundiCabo VerdeCambodiaCameroonCanadaCaribbean small statesCentral African RepublicCentral Europe and the BalticsChadChileChinaColombiaComorosCongo, Dem. Rep.Congo, Rep.Costa RicaCote d'IvoireCroatiaCuracaoCyprusCzech RepublicDenmarkDjiboutiDominicaDominican RepublicEarly-demographic dividendEast Asia & PacificEast Asia & Pacific (excluding high income)East Asia & Pacific (IDA & IBRD countries)EcuadorEgypt, Arab Rep.El SalvadorEquatorial GuineaEritreaEstoniaEthiopiaEuro areaEurope & Central AsiaEurope & Central Asia (excluding high income)Europe & Central Asia (IDA & IBRD countries)European UnionFaroe IslandsFijiFinlandFragile and conflict affected situationsFranceFrench PolynesiaGabonGambia, TheGeorgiaGermanyGhanaGreeceGrenadaGuatemalaGuineaGuinea-BissauGuyanaHaitiHeavily indebted poor countries (HIPC)High incomeHondurasHong Kong SAR, ChinaHungaryIBRD onlyIcelandIDA & IBRD totalIDA onlyIDA totalIndiaIndonesiaIran, Islamic Rep.IraqIrelandIsraelItalyJamaicaJapanJordanKazakhstanKenyaKiribatiKorea, Rep.KosovoKuwaitKyrgyz RepublicLao PDRLate-demographic dividendLatin America & Caribbean Latin America & Caribbean (excluding high income)Latin America & the Caribbean (IDA & IBRD countries)LatviaLeast developed countries: UN classificationLebanonLesothoLiberiaLibyaLithuaniaLow & middle incomeLow incomeLower middle incomeLuxembourgMacao SAR, ChinaMacedonia, FYRMadagascarMalawiMalaysiaMaldivesMaliMaltaMarshall IslandsMauritaniaMauritiusMexicoMicronesia, Fed. Sts.Middle East & North AfricaMiddle East & North Africa (excluding high income)Middle East & North Africa (IDA & IBRD countries)Middle incomeMoldovaMongoliaMontenegroMoroccoMozambiqueMyanmarNamibiaNepalNetherlandsNew CaledoniaNew ZealandNicaraguaNigerNigeriaNorth AmericaNorwayOECD membersOmanOther small statesPacific island small statesPakistanPalauPanamaPapua New GuineaParaguayPeruPhilippinesPolandPortugalPost-demographic dividendPre-demographic dividendQatarRomaniaRussian FederationRwandaSamoaSao Tome and PrincipeSaudi ArabiaSenegalSerbiaSeychellesSierra LeoneSingaporeSint Maarten (Dutch part)Slovak RepublicSloveniaSmall statesSolomon IslandsSouth AfricaSouth AsiaSouth Asia (IDA & IBRD)South SudanSpainSri LankaSt. Kitts and NevisSt. LuciaSt. Vincent and the GrenadinesSub-Saharan Africa Sub-Saharan Africa (excluding high income)Sub-Saharan Africa (IDA & IBRD countries)SudanSurinameSwazilandSwedenSwitzerlandSyrian Arab RepublicTajikistanTanzaniaThailandTimor-LesteTogoTongaTrinidad and TobagoTunisiaTurkeyTuvaluUgandaUkraineUnited KingdomUnited StatesUpper middle incomeUruguayVanuatuVenezuela, RBWest Bank and GazaWorldYemen, Rep.ZambiaZimbabwe Timeline:
This timeline shows a graph from 1969 to 2016 of Colombia. No data until 1968. Number of actual observations by date: 48.
Source name:
World Development Indicators
Source organization:
International Monetary Fund, Balance of Payments Statistics Yearbook and data files.
Categories, topics:
Economy & Growth, Trade
Last updated:
apr 23, 2017
Indicators value changes by year
Minimum:
13.087
jan 1, 1995
Maximum:
32.155
jan 1, 1970
At the date of observation
Value
Absolute change
Change from previous value
jan 1, 1969
31.276
+31.276
0.0%
jan 1, 1970
32.155
+0.88
2.81%
jan 1, 1971
28.443
-3.712
-11.55%
jan 1, 1972
25.7
-2.743
-9.64%
jan 1, 1973
25.479
-0.221
-0.86%
jan 1, 1974
24.087
-1.392
-5.46%
jan 1, 1975
24.778
+0.691
2.87%
jan 1, 1976
28.259
+3.481
14.05%
jan 1, 1977
23.652
-4.607
-16.3%
jan 1, 1978
27.057
+3.404
14.39%
jan 1, 1979
24.549
-2.508
-9.27%
jan 1, 1980
26.158
+1.609
6.55%
jan 1, 1981
23.973
-2.185
-8.35%
jan 1, 1982
20.557
-3.416
-14.25%
jan 1, 1983
17.538
-3.019
-14.69%
jan 1, 1984
21.505
+3.967
22.62%
jan 1, 1985
21.418
-0.088
-0.41%
jan 1, 1986
30.834
+9.416
43.97%
jan 1, 1987
21.734
-9.1
-29.51%
jan 1, 1988
21.767
+0.033
0.15%
jan 1, 1989
20.18
-1.587
-7.29%
jan 1, 1990
18.914
-1.266
-6.27%
jan 1, 1991
27.314
+8.401
44.42%
jan 1, 1992
27.704
+0.39
1.43%
jan 1, 1993
25.583
-2.121
-7.66%
jan 1, 1994
23.665
-1.918
-7.5%
jan 1, 1995
13.087
-10.579
-44.7%
jan 1, 1996
15.619
+2.532
19.35%
jan 1, 1997
18.594
+2.976
19.05%
jan 1, 1998
17.126
-1.468
-7.9%
jan 1, 1999
17.958
+0.832
4.86%
jan 1, 2000
20.334
+2.376
13.23%
jan 1, 2001
17.998
-2.336
-11.49%
jan 1, 2002
16.989
-1.009
-5.6%
jan 1, 2003
17.689
+0.7
4.12%
jan 1, 2004
19.452
+1.763
9.97%
jan 1, 2005
20.175
+0.723
3.71%
jan 1, 2006
20.387
+0.212
1.05%
jan 1, 2007
23.501
+3.114
15.28%
jan 1, 2008
23.184
-0.317
-1.35%
jan 1, 2009
23.821
+0.636
2.74%
jan 1, 2010
29.906
+6.085
25.54%
jan 1, 2011
29.146
-0.76
-2.54%
jan 1, 2012
30.509
+1.363
4.68%
jan 1, 2013
28.573
-1.936
-6.34%
jan 1, 2014
32.146
+3.572
12.5%
jan 1, 2015
30.071
-2.075
-6.46%
jan 1, 2016
27.623
-2.448
-8.14%
Ranking of countries by current statistics by years


Comments: