29
/
en
AIzaSyAYiBZKx7MnpbEhh9jyipgxe19OcubqV5w
April 1, 2024
272011
Uganda
UGA
true
2
1
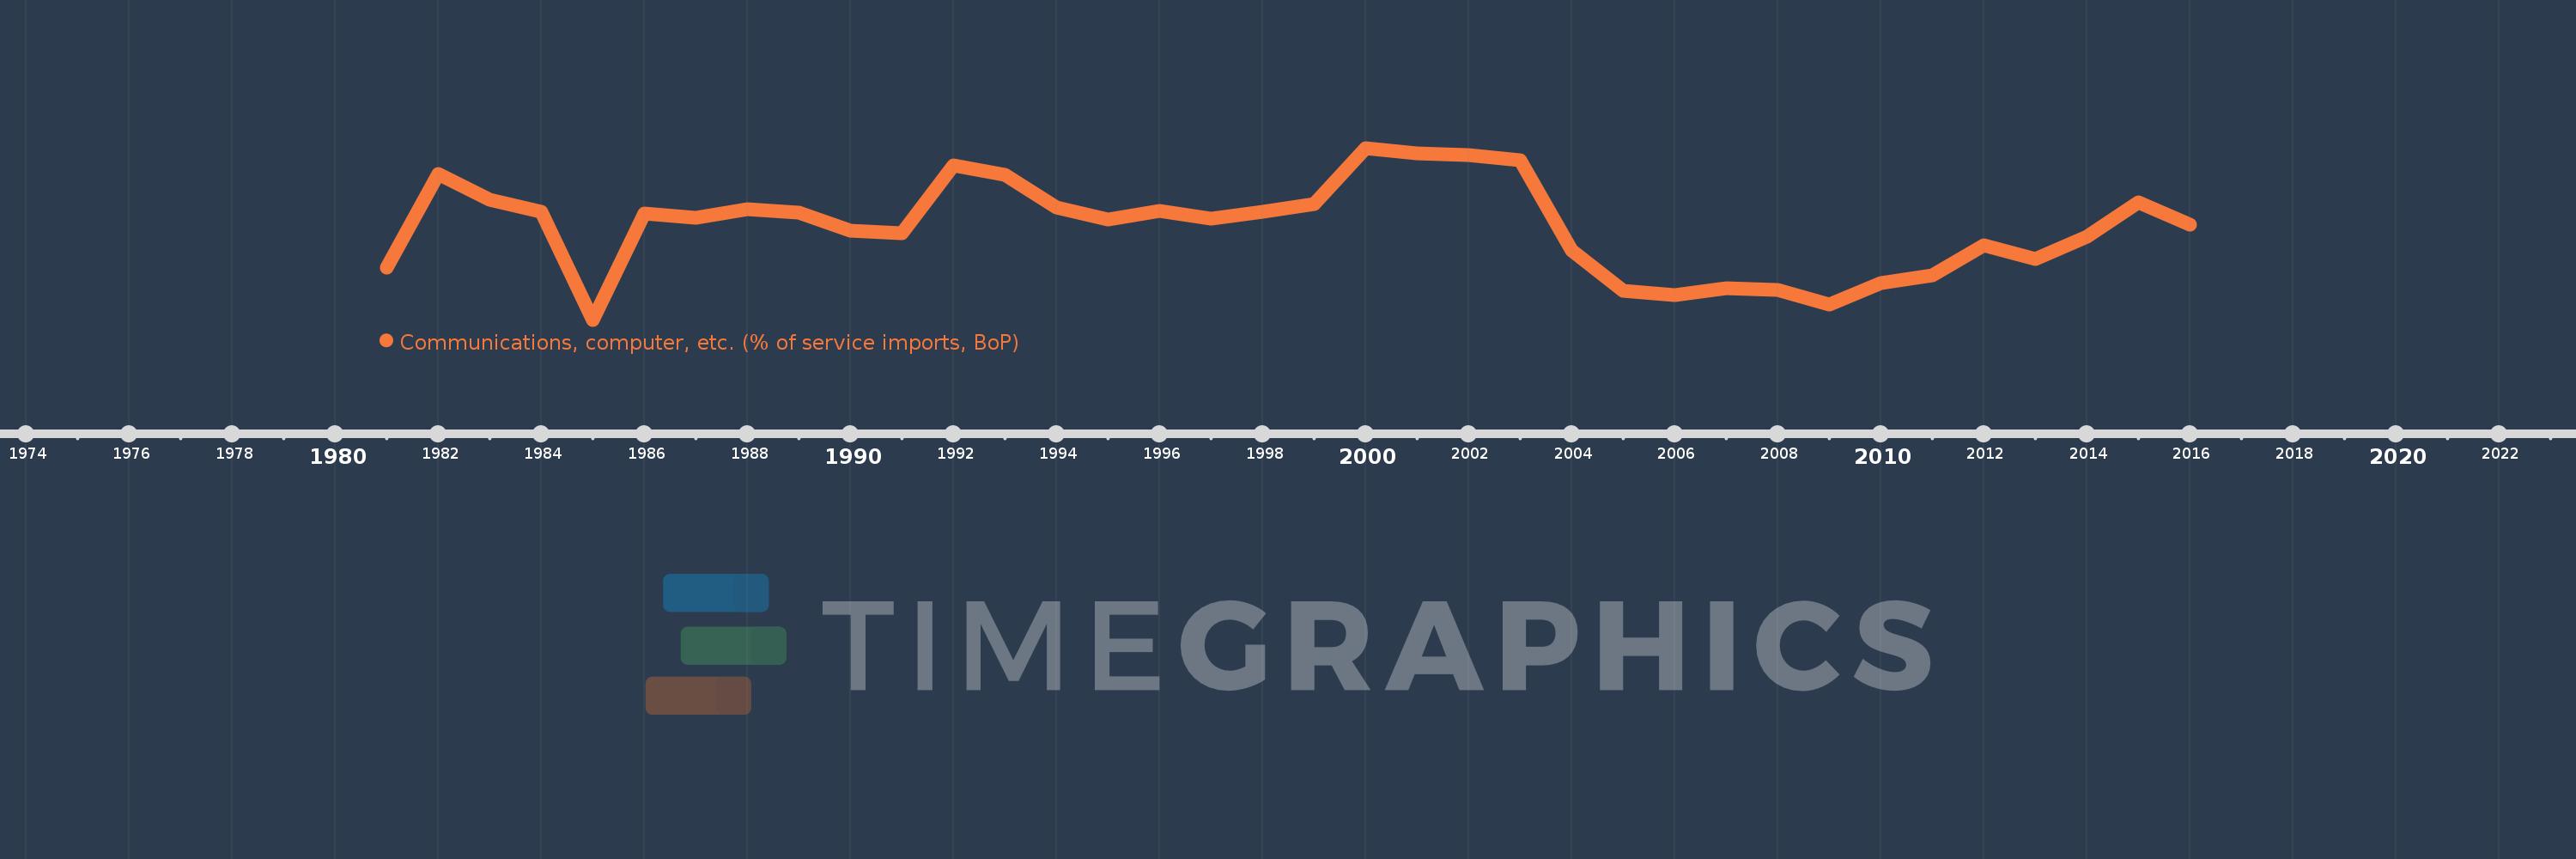
Communications, computer, etc. (% of service imports, BoP)
2016,2015,2014,2013,2012,2011,2010,2009,2008,2007,2006,2005,2004,2003,2002,2001,2000,1999,1998,1997,1996,1995,1994,1993,1992,1991,1990,1989,1988,1987,1986,1985,1984,1983,1982,1981
This statistics in other country:
AfghanistanAlbaniaAlgeriaAngolaAntigua and BarbudaArab WorldArgentinaArmeniaArubaAustraliaAustriaAzerbaijanBahamas, TheBahrainBangladeshBarbadosBelarusBelgiumBelizeBeninBermudaBhutanBoliviaBosnia and HerzegovinaBotswanaBrazilBrunei DarussalamBulgariaBurkina FasoBurundiCabo VerdeCambodiaCameroonCanadaCaribbean small statesCentral African RepublicCentral Europe and the BalticsChadChileChinaColombiaComorosCongo, Dem. Rep.Congo, Rep.Costa RicaCote d'IvoireCroatiaCuracaoCyprusCzech RepublicDenmarkDjiboutiDominicaDominican RepublicEarly-demographic dividendEast Asia & PacificEast Asia & Pacific (excluding high income)East Asia & Pacific (IDA & IBRD countries)EcuadorEgypt, Arab Rep.El SalvadorEquatorial GuineaEritreaEstoniaEthiopiaEuro areaEurope & Central AsiaEurope & Central Asia (excluding high income)Europe & Central Asia (IDA & IBRD countries)European UnionFaroe IslandsFijiFinlandFragile and conflict affected situationsFranceFrench PolynesiaGabonGambia, TheGeorgiaGermanyGhanaGreeceGrenadaGuatemalaGuineaGuinea-BissauGuyanaHaitiHeavily indebted poor countries (HIPC)High incomeHondurasHong Kong SAR, ChinaHungaryIBRD onlyIcelandIDA & IBRD totalIDA onlyIDA totalIndiaIndonesiaIran, Islamic Rep.IraqIrelandIsraelItalyJamaicaJapanJordanKazakhstanKenyaKiribatiKorea, Rep.KosovoKuwaitKyrgyz RepublicLao PDRLate-demographic dividendLatin America & Caribbean Latin America & Caribbean (excluding high income)Latin America & the Caribbean (IDA & IBRD countries)LatviaLeast developed countries: UN classificationLebanonLesothoLiberiaLibyaLithuaniaLow & middle incomeLow incomeLower middle incomeLuxembourgMacao SAR, ChinaMacedonia, FYRMadagascarMalawiMalaysiaMaldivesMaliMaltaMarshall IslandsMauritaniaMauritiusMexicoMicronesia, Fed. Sts.Middle East & North AfricaMiddle East & North Africa (excluding high income)Middle East & North Africa (IDA & IBRD countries)Middle incomeMoldovaMongoliaMontenegroMoroccoMozambiqueMyanmarNamibiaNepalNetherlandsNew CaledoniaNew ZealandNicaraguaNigerNigeriaNorth AmericaNorwayOECD membersOmanOther small statesPacific island small statesPakistanPalauPanamaPapua New GuineaParaguayPeruPhilippinesPolandPortugalPost-demographic dividendPre-demographic dividendQatarRomaniaRussian FederationRwandaSamoaSao Tome and PrincipeSaudi ArabiaSenegalSerbiaSeychellesSierra LeoneSingaporeSint Maarten (Dutch part)Slovak RepublicSloveniaSmall statesSolomon IslandsSouth AfricaSouth AsiaSouth Asia (IDA & IBRD)South SudanSpainSri LankaSt. Kitts and NevisSt. LuciaSt. Vincent and the GrenadinesSub-Saharan Africa Sub-Saharan Africa (excluding high income)Sub-Saharan Africa (IDA & IBRD countries)SudanSurinameSwazilandSwedenSwitzerlandSyrian Arab RepublicTajikistanTanzaniaThailandTimor-LesteTogoTongaTrinidad and TobagoTunisiaTurkeyTuvaluUgandaUkraineUnited KingdomUnited StatesUpper middle incomeUruguayVanuatuVenezuela, RBWest Bank and GazaWorldYemen, Rep.ZambiaZimbabwe Timeline:
This timeline shows a graph from 1981 to 2016 of Uganda. No data until 1980. Number of actual observations by date: 36.
Source name:
World Development Indicators
Source organization:
International Monetary Fund, Balance of Payments Statistics Yearbook and data files.
Categories, topics:
Economy & Growth, Trade
Last updated:
apr 23, 2017
Indicators value changes by year
Maximum:
65.935
jan 1, 2000
At the date of observation
Value
Absolute change
Change from previous value
jan 1, 1981
22.771
+22.771
0.0%
jan 1, 1982
56.673
+33.902
148.88%
jan 1, 1983
47.382
-9.292
-16.4%
jan 1, 1984
42.933
-4.448
-9.39%
jan 1, 1985
3.888
-39.045
-90.94%
jan 1, 1986
42.34
+38.452
988.94%
jan 1, 1987
40.766
-1.574
-3.72%
jan 1, 1988
43.767
+3.001
7.36%
jan 1, 1989
42.645
-1.123
-2.56%
jan 1, 1990
36.046
-6.599
-15.47%
jan 1, 1991
35.177
-0.869
-2.41%
jan 1, 1992
59.76
+24.583
69.89%
jan 1, 1993
56.076
-3.684
-6.17%
jan 1, 1994
44.386
-11.69
-20.85%
jan 1, 1995
39.995
-4.391
-9.89%
jan 1, 1996
43.276
+3.281
8.2%
jan 1, 1997
40.543
-2.733
-6.31%
jan 1, 1998
42.937
+2.393
5.9%
jan 1, 1999
45.718
+2.781
6.48%
jan 1, 2000
65.935
+20.217
44.22%
jan 1, 2001
63.971
-1.964
-2.98%
jan 1, 2002
63.439
-0.532
-0.83%
jan 1, 2003
61.458
-1.981
-3.12%
jan 1, 2004
28.999
-32.459
-52.82%
jan 1, 2005
14.384
-14.615
-50.4%
jan 1, 2006
12.938
-1.445
-10.05%
jan 1, 2007
15.289
+2.351
18.17%
jan 1, 2008
14.701
-0.588
-3.85%
jan 1, 2009
9.417
-5.284
-35.94%
jan 1, 2010
16.981
+7.563
80.31%
jan 1, 2011
19.96
+2.979
17.54%
jan 1, 2012
30.804
+10.845
54.33%
jan 1, 2013
25.698
-5.106
-16.58%
jan 1, 2014
33.8
+8.102
31.53%
jan 1, 2015
46.205
+12.405
36.7%
jan 1, 2016
38.142
-8.063
-17.45%
Ranking of countries by current statistics by years


Comments: