29
/
en
AIzaSyAYiBZKx7MnpbEhh9jyipgxe19OcubqV5w
April 1, 2024
250570
St. Lucia
LCA
true
2
1
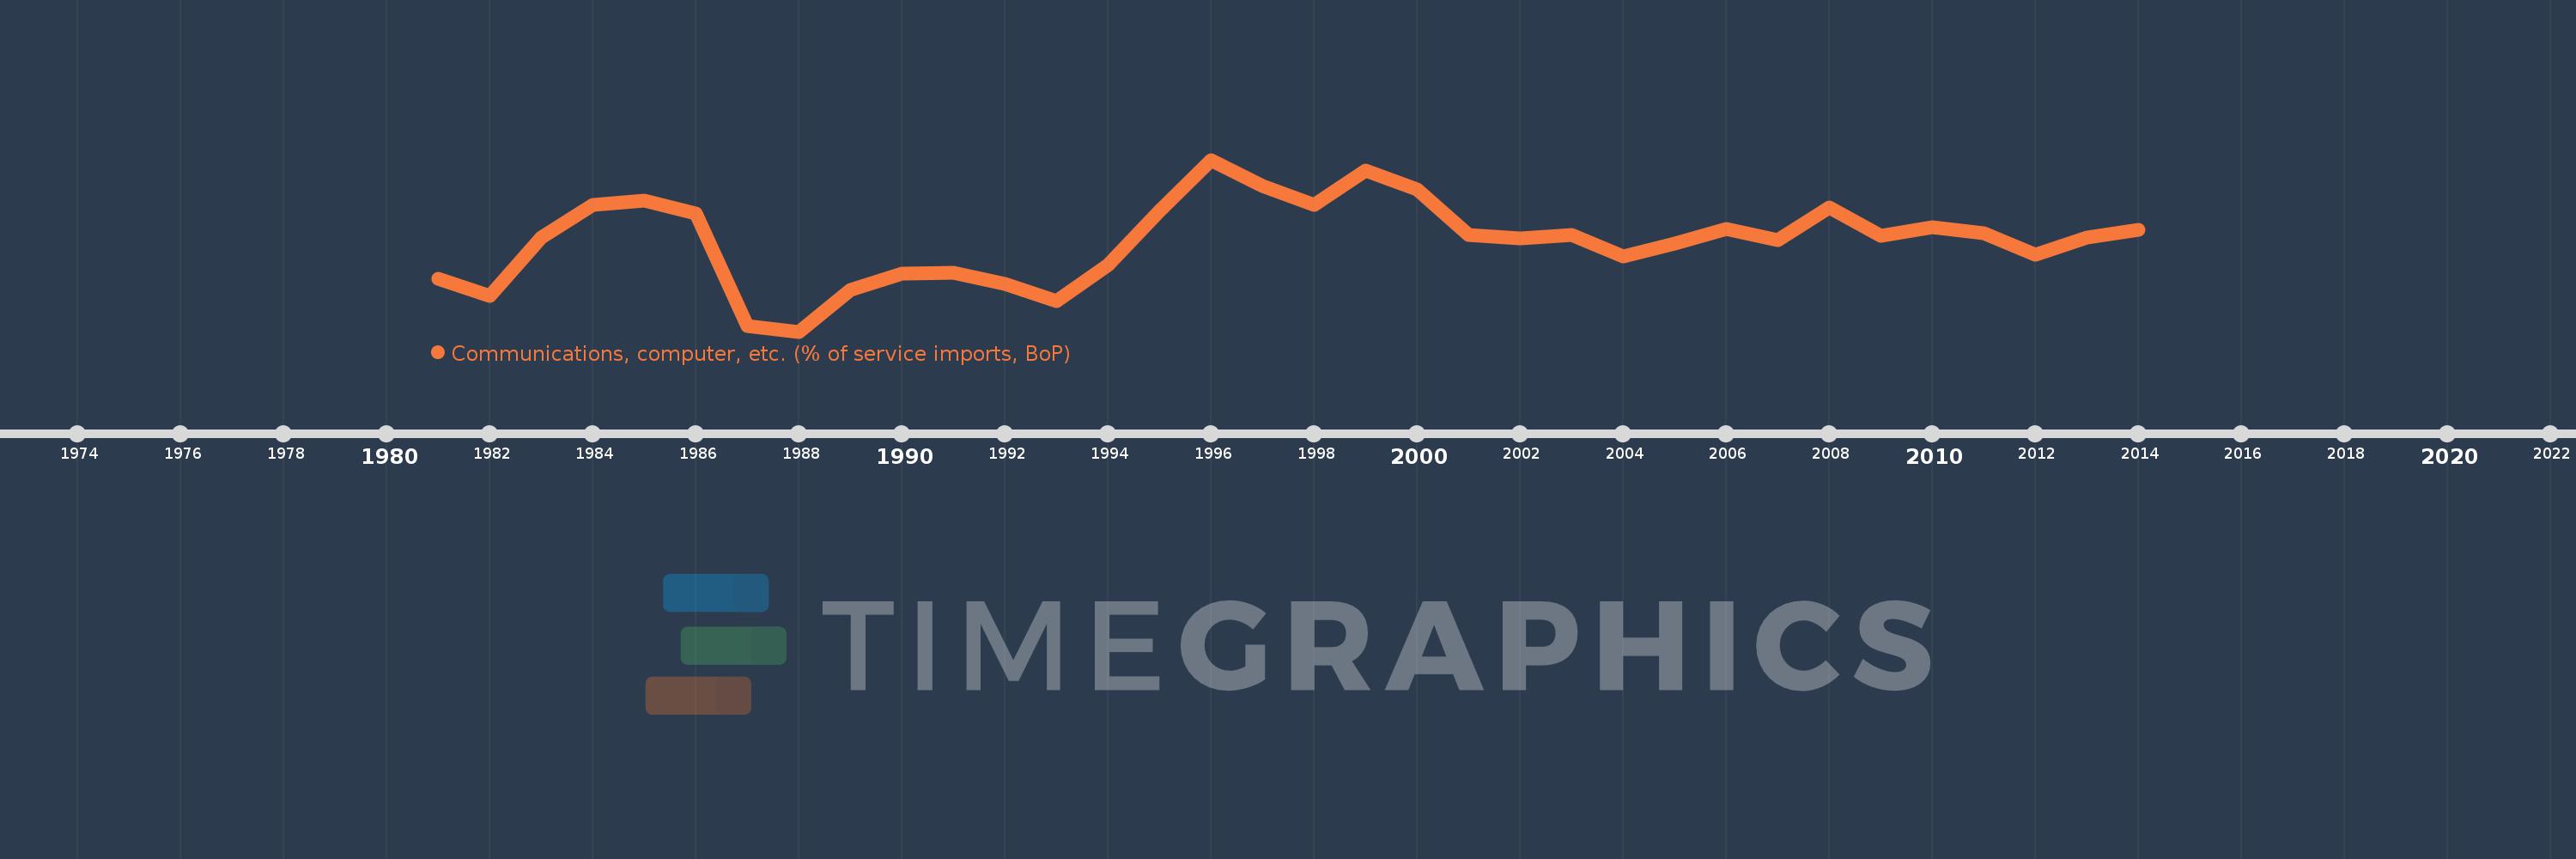
Communications, computer, etc. (% of service imports, BoP)
2014,2013,2012,2011,2010,2009,2008,2007,2006,2005,2004,2003,2002,2001,2000,1999,1998,1997,1996,1995,1994,1993,1992,1991,1990,1989,1988,1987,1986,1985,1984,1983,1982,1981
This statistics in other country:
AfghanistanAlbaniaAlgeriaAngolaAntigua and BarbudaArab WorldArgentinaArmeniaArubaAustraliaAustriaAzerbaijanBahamas, TheBahrainBangladeshBarbadosBelarusBelgiumBelizeBeninBermudaBhutanBoliviaBosnia and HerzegovinaBotswanaBrazilBrunei DarussalamBulgariaBurkina FasoBurundiCabo VerdeCambodiaCameroonCanadaCaribbean small statesCentral African RepublicCentral Europe and the BalticsChadChileChinaColombiaComorosCongo, Dem. Rep.Congo, Rep.Costa RicaCote d'IvoireCroatiaCuracaoCyprusCzech RepublicDenmarkDjiboutiDominicaDominican RepublicEarly-demographic dividendEast Asia & PacificEast Asia & Pacific (excluding high income)East Asia & Pacific (IDA & IBRD countries)EcuadorEgypt, Arab Rep.El SalvadorEquatorial GuineaEritreaEstoniaEthiopiaEuro areaEurope & Central AsiaEurope & Central Asia (excluding high income)Europe & Central Asia (IDA & IBRD countries)European UnionFaroe IslandsFijiFinlandFragile and conflict affected situationsFranceFrench PolynesiaGabonGambia, TheGeorgiaGermanyGhanaGreeceGrenadaGuatemalaGuineaGuinea-BissauGuyanaHaitiHeavily indebted poor countries (HIPC)High incomeHondurasHong Kong SAR, ChinaHungaryIBRD onlyIcelandIDA & IBRD totalIDA onlyIDA totalIndiaIndonesiaIran, Islamic Rep.IraqIrelandIsraelItalyJamaicaJapanJordanKazakhstanKenyaKiribatiKorea, Rep.KosovoKuwaitKyrgyz RepublicLao PDRLate-demographic dividendLatin America & Caribbean Latin America & Caribbean (excluding high income)Latin America & the Caribbean (IDA & IBRD countries)LatviaLeast developed countries: UN classificationLebanonLesothoLiberiaLibyaLithuaniaLow & middle incomeLow incomeLower middle incomeLuxembourgMacao SAR, ChinaMacedonia, FYRMadagascarMalawiMalaysiaMaldivesMaliMaltaMarshall IslandsMauritaniaMauritiusMexicoMicronesia, Fed. Sts.Middle East & North AfricaMiddle East & North Africa (excluding high income)Middle East & North Africa (IDA & IBRD countries)Middle incomeMoldovaMongoliaMontenegroMoroccoMozambiqueMyanmarNamibiaNepalNetherlandsNew CaledoniaNew ZealandNicaraguaNigerNigeriaNorth AmericaNorwayOECD membersOmanOther small statesPacific island small statesPakistanPalauPanamaPapua New GuineaParaguayPeruPhilippinesPolandPortugalPost-demographic dividendPre-demographic dividendQatarRomaniaRussian FederationRwandaSamoaSao Tome and PrincipeSaudi ArabiaSenegalSerbiaSeychellesSierra LeoneSingaporeSint Maarten (Dutch part)Slovak RepublicSloveniaSmall statesSolomon IslandsSouth AfricaSouth AsiaSouth Asia (IDA & IBRD)South SudanSpainSri LankaSt. Kitts and NevisSt. LuciaSt. Vincent and the GrenadinesSub-Saharan Africa Sub-Saharan Africa (excluding high income)Sub-Saharan Africa (IDA & IBRD countries)SudanSurinameSwazilandSwedenSwitzerlandSyrian Arab RepublicTajikistanTanzaniaThailandTimor-LesteTogoTongaTrinidad and TobagoTunisiaTurkeyTuvaluUgandaUkraineUnited KingdomUnited StatesUpper middle incomeUruguayVanuatuVenezuela, RBWest Bank and GazaWorldYemen, Rep.ZambiaZimbabwe Timeline:
This timeline shows a graph from 1981 to 2014 of St. Lucia. No data until 1980. Number of actual observations by date: 34.
Source name:
World Development Indicators
Source organization:
International Monetary Fund, Balance of Payments Statistics Yearbook and data files.
Categories, topics:
Economy & Growth, Trade
Last updated:
apr 23, 2017
Indicators value changes by year
Minimum:
11.305
jan 1, 1988
Maximum:
40.723
jan 1, 1996
At the date of observation
Value
Absolute change
Change from previous value
jan 1, 1981
20.314
+20.314
0.0%
jan 1, 1982
17.354
-2.961
-14.57%
jan 1, 1983
27.389
+10.035
57.83%
jan 1, 1984
32.98
+5.59
20.41%
jan 1, 1985
33.694
+0.715
2.17%
jan 1, 1986
31.601
-2.094
-6.21%
jan 1, 1987
12.221
-19.379
-61.33%
jan 1, 1988
11.305
-0.916
-7.5%
jan 1, 1989
18.505
+7.2
63.69%
jan 1, 1990
21.292
+2.787
15.06%
jan 1, 1991
21.355
+0.063
0.3%
jan 1, 1992
19.426
-1.929
-9.03%
jan 1, 1993
16.569
-2.857
-14.71%
jan 1, 1994
22.75
+6.181
37.3%
jan 1, 1995
31.945
+9.195
40.42%
jan 1, 1996
40.723
+8.777
27.48%
jan 1, 1997
36.179
-4.544
-11.16%
jan 1, 1998
33.006
-3.173
-8.77%
jan 1, 1999
38.838
+5.832
17.67%
jan 1, 2000
35.604
-3.234
-8.33%
jan 1, 2001
27.829
-7.775
-21.84%
jan 1, 2002
27.321
-0.508
-1.83%
jan 1, 2003
27.853
+0.532
1.95%
jan 1, 2004
24.137
-3.716
-13.34%
jan 1, 2005
26.351
+2.214
9.17%
jan 1, 2006
28.864
+2.514
9.54%
jan 1, 2007
26.906
-1.959
-6.79%
jan 1, 2008
32.492
+5.586
20.76%
jan 1, 2009
27.659
-4.833
-14.88%
jan 1, 2010
29.182
+1.524
5.51%
jan 1, 2011
28.127
-1.055
-3.62%
jan 1, 2012
24.523
-3.605
-12.82%
jan 1, 2013
27.361
+2.838
11.57%
jan 1, 2014
28.77
+1.409
5.15%
Ranking of countries by current statistics by years


Comments: