29
/
en
AIzaSyAYiBZKx7MnpbEhh9jyipgxe19OcubqV5w
April 1, 2024
144134
Guatemala
GTM
true
2
1
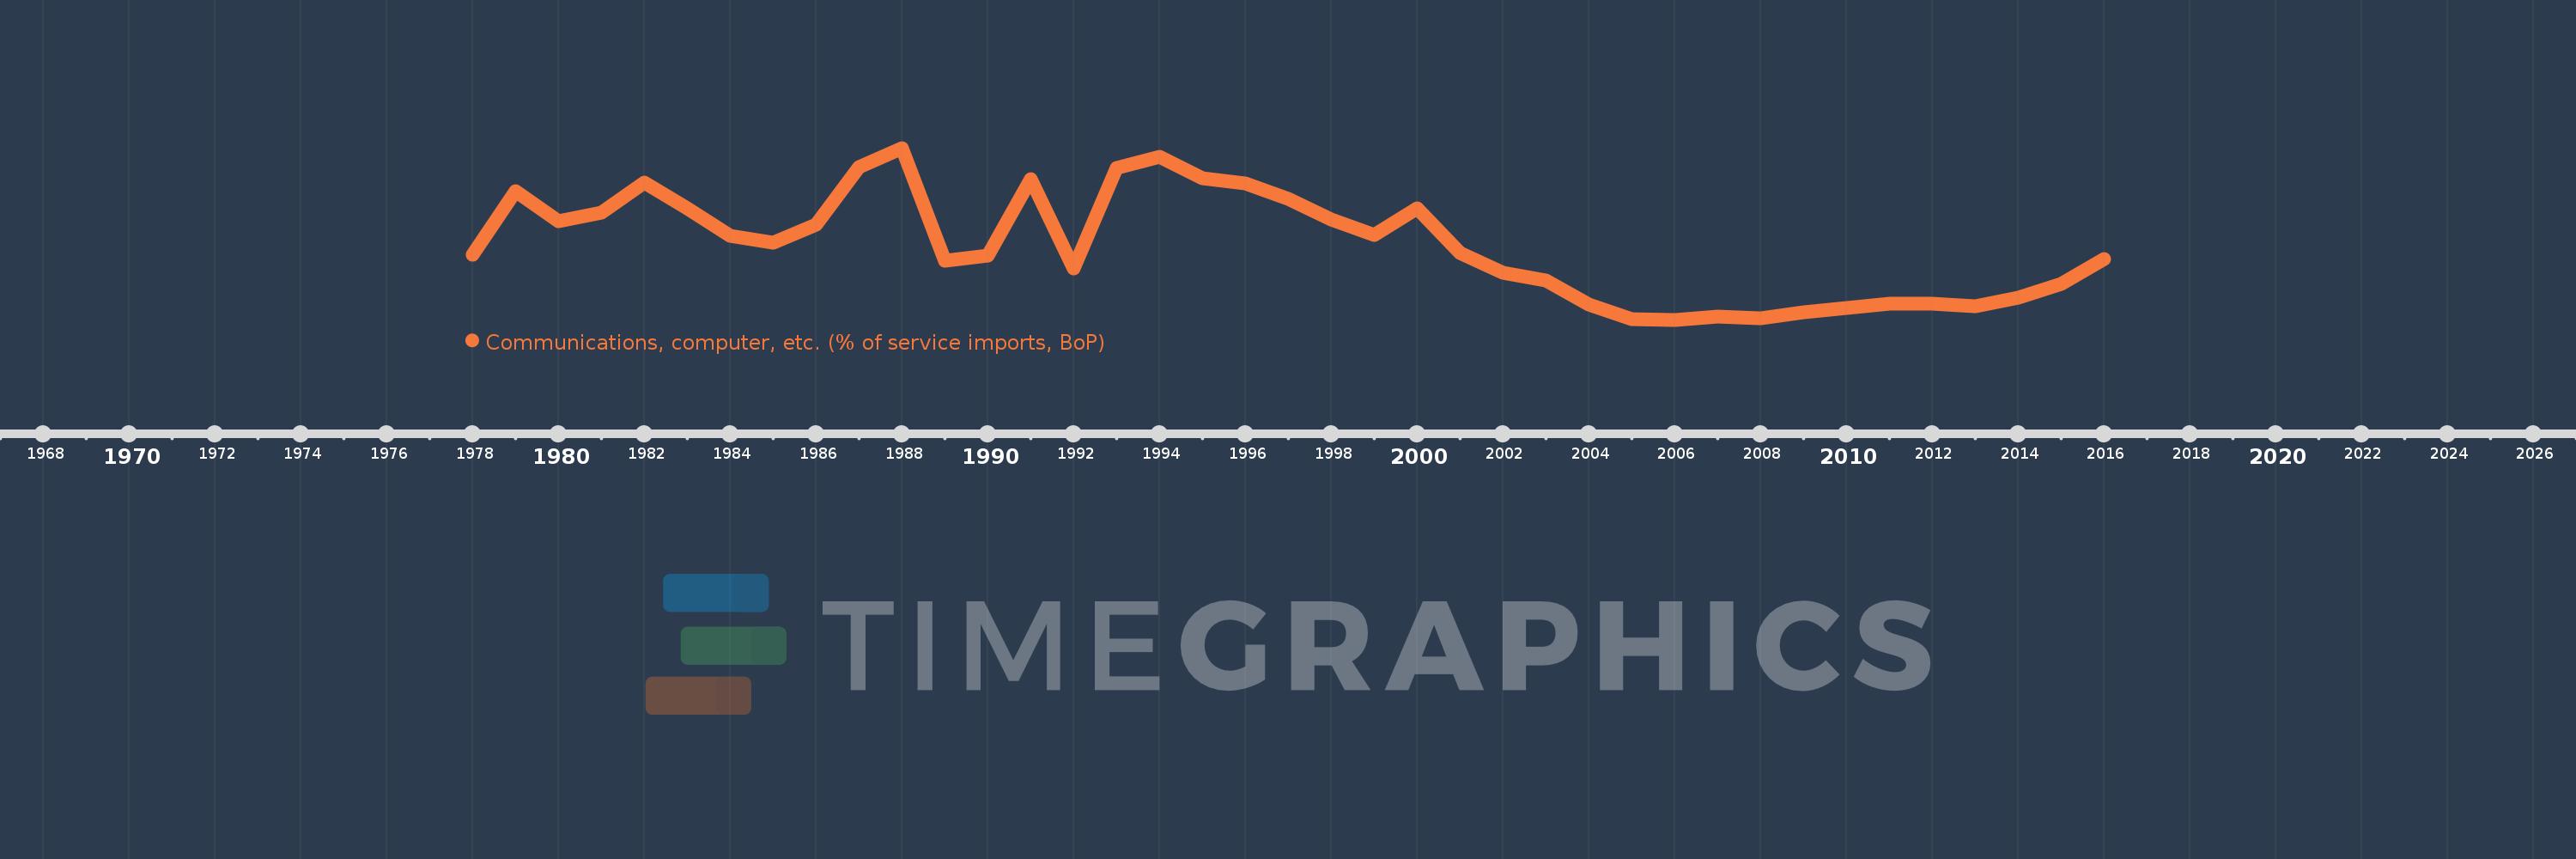
Communications, computer, etc. (% of service imports, BoP)
2016,2015,2014,2013,2012,2011,2010,2009,2008,2007,2006,2005,2004,2003,2002,2001,2000,1999,1998,1997,1996,1995,1994,1993,1992,1991,1990,1989,1988,1987,1986,1985,1984,1983,1982,1981,1980,1979,1978
This statistics in other country:
AfghanistanAlbaniaAlgeriaAngolaAntigua and BarbudaArab WorldArgentinaArmeniaArubaAustraliaAustriaAzerbaijanBahamas, TheBahrainBangladeshBarbadosBelarusBelgiumBelizeBeninBermudaBhutanBoliviaBosnia and HerzegovinaBotswanaBrazilBrunei DarussalamBulgariaBurkina FasoBurundiCabo VerdeCambodiaCameroonCanadaCaribbean small statesCentral African RepublicCentral Europe and the BalticsChadChileChinaColombiaComorosCongo, Dem. Rep.Congo, Rep.Costa RicaCote d'IvoireCroatiaCuracaoCyprusCzech RepublicDenmarkDjiboutiDominicaDominican RepublicEarly-demographic dividendEast Asia & PacificEast Asia & Pacific (excluding high income)East Asia & Pacific (IDA & IBRD countries)EcuadorEgypt, Arab Rep.El SalvadorEquatorial GuineaEritreaEstoniaEthiopiaEuro areaEurope & Central AsiaEurope & Central Asia (excluding high income)Europe & Central Asia (IDA & IBRD countries)European UnionFaroe IslandsFijiFinlandFragile and conflict affected situationsFranceFrench PolynesiaGabonGambia, TheGeorgiaGermanyGhanaGreeceGrenadaGuatemalaGuineaGuinea-BissauGuyanaHaitiHeavily indebted poor countries (HIPC)High incomeHondurasHong Kong SAR, ChinaHungaryIBRD onlyIcelandIDA & IBRD totalIDA onlyIDA totalIndiaIndonesiaIran, Islamic Rep.IraqIrelandIsraelItalyJamaicaJapanJordanKazakhstanKenyaKiribatiKorea, Rep.KosovoKuwaitKyrgyz RepublicLao PDRLate-demographic dividendLatin America & Caribbean Latin America & Caribbean (excluding high income)Latin America & the Caribbean (IDA & IBRD countries)LatviaLeast developed countries: UN classificationLebanonLesothoLiberiaLibyaLithuaniaLow & middle incomeLow incomeLower middle incomeLuxembourgMacao SAR, ChinaMacedonia, FYRMadagascarMalawiMalaysiaMaldivesMaliMaltaMarshall IslandsMauritaniaMauritiusMexicoMicronesia, Fed. Sts.Middle East & North AfricaMiddle East & North Africa (excluding high income)Middle East & North Africa (IDA & IBRD countries)Middle incomeMoldovaMongoliaMontenegroMoroccoMozambiqueMyanmarNamibiaNepalNetherlandsNew CaledoniaNew ZealandNicaraguaNigerNigeriaNorth AmericaNorwayOECD membersOmanOther small statesPacific island small statesPakistanPalauPanamaPapua New GuineaParaguayPeruPhilippinesPolandPortugalPost-demographic dividendPre-demographic dividendQatarRomaniaRussian FederationRwandaSamoaSao Tome and PrincipeSaudi ArabiaSenegalSerbiaSeychellesSierra LeoneSingaporeSint Maarten (Dutch part)Slovak RepublicSloveniaSmall statesSolomon IslandsSouth AfricaSouth AsiaSouth Asia (IDA & IBRD)South SudanSpainSri LankaSt. Kitts and NevisSt. LuciaSt. Vincent and the GrenadinesSub-Saharan Africa Sub-Saharan Africa (excluding high income)Sub-Saharan Africa (IDA & IBRD countries)SudanSurinameSwazilandSwedenSwitzerlandSyrian Arab RepublicTajikistanTanzaniaThailandTimor-LesteTogoTongaTrinidad and TobagoTunisiaTurkeyTuvaluUgandaUkraineUnited KingdomUnited StatesUpper middle incomeUruguayVanuatuVenezuela, RBWest Bank and GazaWorldYemen, Rep.ZambiaZimbabwe Timeline:
This timeline shows a graph from 1978 to 2016 of Guatemala. No data until 1977. Number of actual observations by date: 39.
Source name:
World Development Indicators
Source organization:
International Monetary Fund, Balance of Payments Statistics Yearbook and data files.
Categories, topics:
Economy & Growth, Trade
Last updated:
apr 23, 2017
Indicators value changes by year
Maximum:
37.418
jan 1, 1988
At the date of observation
Value
Absolute change
Change from previous value
jan 1, 1978
18.616
+18.616
0.0%
jan 1, 1979
29.778
+11.163
59.96%
jan 1, 1980
24.537
-5.242
-17.6%
jan 1, 1981
26.016
+1.479
6.03%
jan 1, 1982
31.303
+5.287
20.32%
jan 1, 1983
26.762
-4.541
-14.51%
jan 1, 1984
22.033
-4.73
-17.67%
jan 1, 1985
20.815
-1.218
-5.53%
jan 1, 1986
23.889
+3.074
14.77%
jan 1, 1987
33.98
+10.091
42.24%
jan 1, 1988
37.418
+3.438
10.12%
jan 1, 1989
17.616
-19.803
-52.92%
jan 1, 1990
18.44
+0.824
4.68%
jan 1, 1991
32.004
+13.564
73.56%
jan 1, 1992
16.218
-15.786
-49.33%
jan 1, 1993
33.962
+17.744
109.41%
jan 1, 1994
35.864
+1.903
5.6%
jan 1, 1995
32.114
-3.751
-10.46%
jan 1, 1996
31.223
-0.89
-2.77%
jan 1, 1997
28.418
-2.805
-8.98%
jan 1, 1998
24.796
-3.621
-12.74%
jan 1, 1999
22.203
-2.594
-10.46%
jan 1, 2000
26.761
+4.559
20.53%
jan 1, 2001
18.93
-7.831
-29.26%
jan 1, 2002
15.435
-3.495
-18.46%
jan 1, 2003
14.184
-1.251
-8.1%
jan 1, 2004
9.909
-4.276
-30.14%
jan 1, 2005
7.35
-2.559
-25.83%
jan 1, 2006
7.243
-0.106
-1.44%
jan 1, 2007
7.737
+0.494
6.82%
jan 1, 2008
7.447
-0.291
-3.76%
jan 1, 2009
8.603
+1.156
15.52%
jan 1, 2010
9.382
+0.78
9.06%
jan 1, 2011
10.019
+0.637
6.79%
jan 1, 2012
10.064
+0.045
0.45%
jan 1, 2013
9.572
-0.493
-4.9%
jan 1, 2014
11.159
+1.587
16.58%
jan 1, 2015
13.466
+2.307
20.68%
jan 1, 2016
17.847
+4.381
32.53%
Ranking of countries by current statistics by years


Comments: