29
/
en
AIzaSyAYiBZKx7MnpbEhh9jyipgxe19OcubqV5w
April 1, 2024
243432
Solomon Islands
SLB
true
2
1
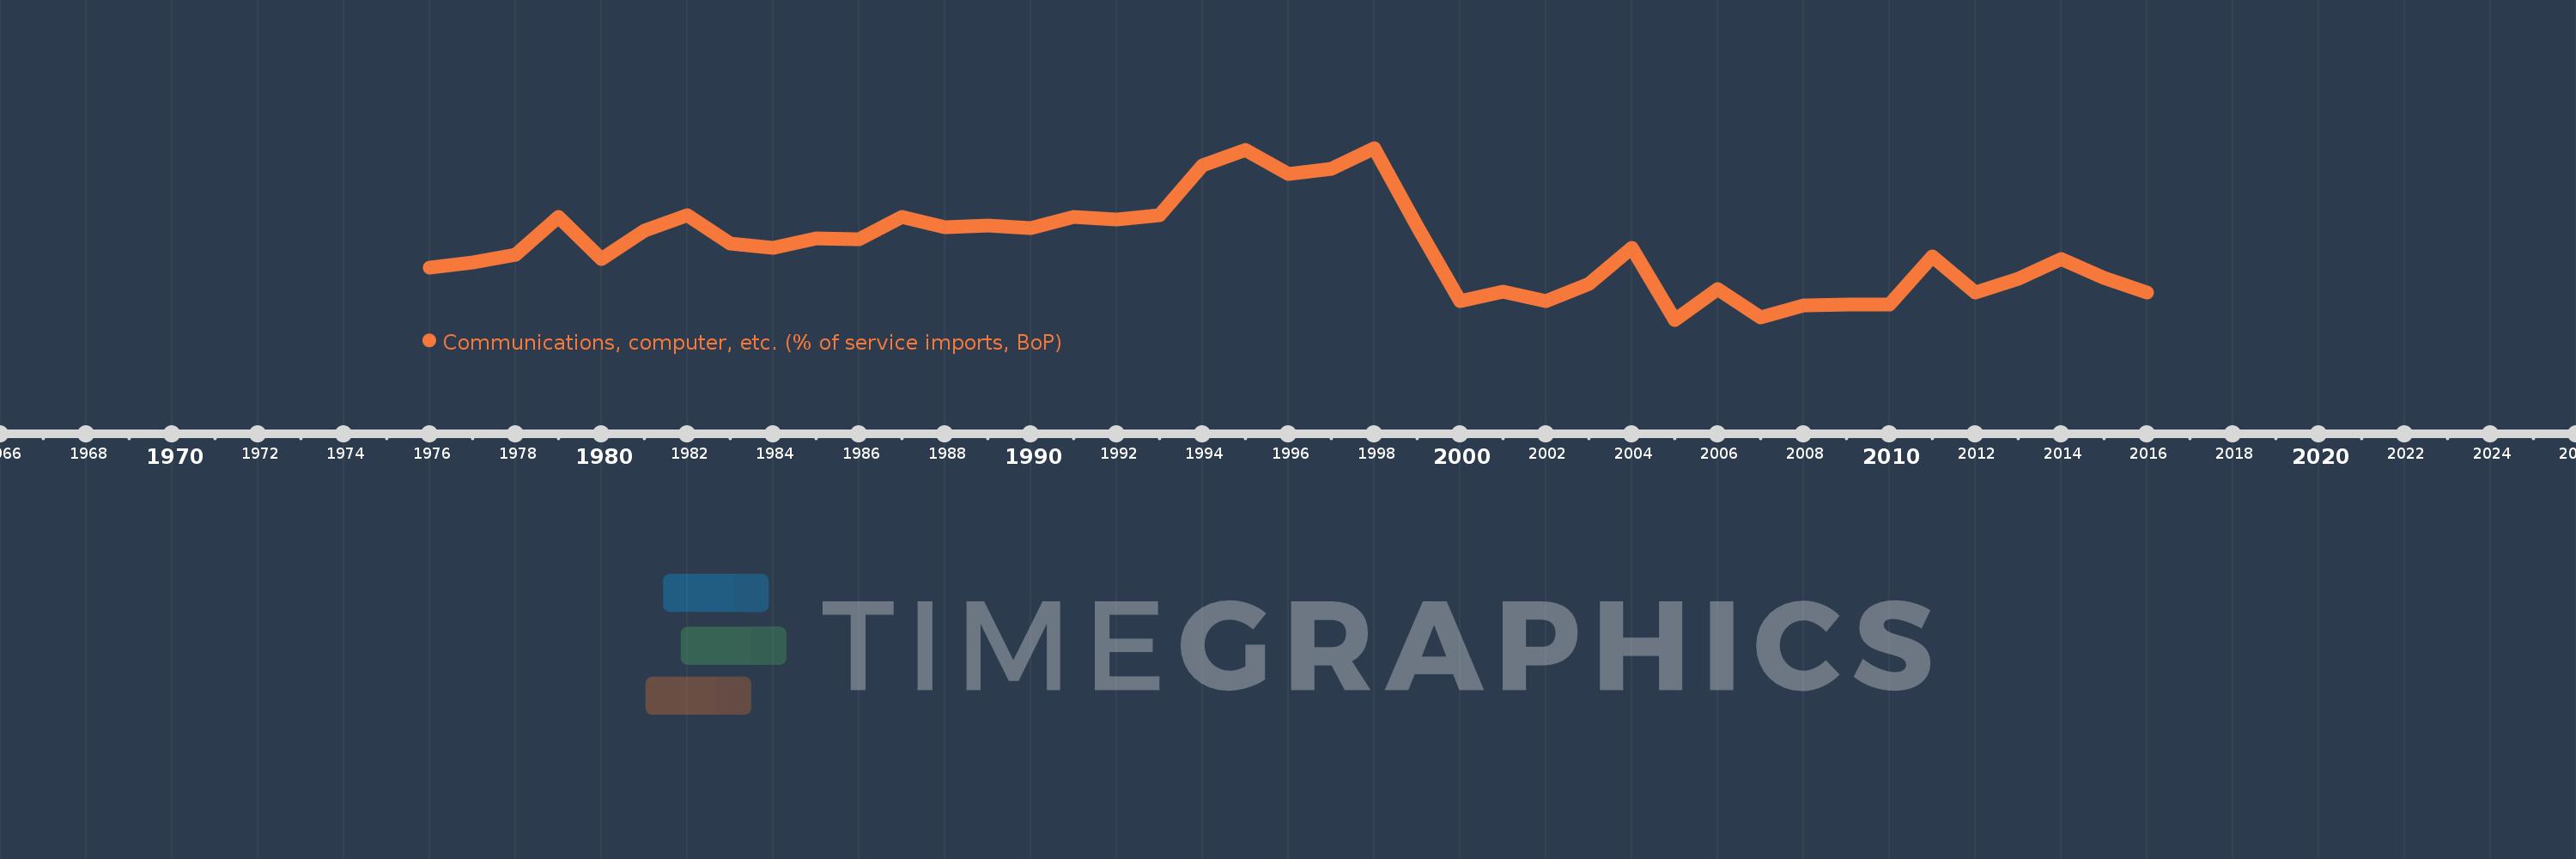
Communications, computer, etc. (% of service imports, BoP)
2016,2015,2014,2013,2012,2011,2010,2009,2008,2007,2006,2005,2004,2003,2002,2001,2000,1999,1998,1997,1996,1995,1994,1993,1992,1991,1990,1989,1988,1987,1986,1985,1984,1983,1982,1981,1980,1979,1978,1977,1976
This statistics in other country:
AfghanistanAlbaniaAlgeriaAngolaAntigua and BarbudaArab WorldArgentinaArmeniaArubaAustraliaAustriaAzerbaijanBahamas, TheBahrainBangladeshBarbadosBelarusBelgiumBelizeBeninBermudaBhutanBoliviaBosnia and HerzegovinaBotswanaBrazilBrunei DarussalamBulgariaBurkina FasoBurundiCabo VerdeCambodiaCameroonCanadaCaribbean small statesCentral African RepublicCentral Europe and the BalticsChadChileChinaColombiaComorosCongo, Dem. Rep.Congo, Rep.Costa RicaCote d'IvoireCroatiaCuracaoCyprusCzech RepublicDenmarkDjiboutiDominicaDominican RepublicEarly-demographic dividendEast Asia & PacificEast Asia & Pacific (excluding high income)East Asia & Pacific (IDA & IBRD countries)EcuadorEgypt, Arab Rep.El SalvadorEquatorial GuineaEritreaEstoniaEthiopiaEuro areaEurope & Central AsiaEurope & Central Asia (excluding high income)Europe & Central Asia (IDA & IBRD countries)European UnionFaroe IslandsFijiFinlandFragile and conflict affected situationsFranceFrench PolynesiaGabonGambia, TheGeorgiaGermanyGhanaGreeceGrenadaGuatemalaGuineaGuinea-BissauGuyanaHaitiHeavily indebted poor countries (HIPC)High incomeHondurasHong Kong SAR, ChinaHungaryIBRD onlyIcelandIDA & IBRD totalIDA onlyIDA totalIndiaIndonesiaIran, Islamic Rep.IraqIrelandIsraelItalyJamaicaJapanJordanKazakhstanKenyaKiribatiKorea, Rep.KosovoKuwaitKyrgyz RepublicLao PDRLate-demographic dividendLatin America & Caribbean Latin America & Caribbean (excluding high income)Latin America & the Caribbean (IDA & IBRD countries)LatviaLeast developed countries: UN classificationLebanonLesothoLiberiaLibyaLithuaniaLow & middle incomeLow incomeLower middle incomeLuxembourgMacao SAR, ChinaMacedonia, FYRMadagascarMalawiMalaysiaMaldivesMaliMaltaMarshall IslandsMauritaniaMauritiusMexicoMicronesia, Fed. Sts.Middle East & North AfricaMiddle East & North Africa (excluding high income)Middle East & North Africa (IDA & IBRD countries)Middle incomeMoldovaMongoliaMontenegroMoroccoMozambiqueMyanmarNamibiaNepalNetherlandsNew CaledoniaNew ZealandNicaraguaNigerNigeriaNorth AmericaNorwayOECD membersOmanOther small statesPacific island small statesPakistanPalauPanamaPapua New GuineaParaguayPeruPhilippinesPolandPortugalPost-demographic dividendPre-demographic dividendQatarRomaniaRussian FederationRwandaSamoaSao Tome and PrincipeSaudi ArabiaSenegalSerbiaSeychellesSierra LeoneSingaporeSint Maarten (Dutch part)Slovak RepublicSloveniaSmall statesSolomon IslandsSouth AfricaSouth AsiaSouth Asia (IDA & IBRD)South SudanSpainSri LankaSt. Kitts and NevisSt. LuciaSt. Vincent and the GrenadinesSub-Saharan Africa Sub-Saharan Africa (excluding high income)Sub-Saharan Africa (IDA & IBRD countries)SudanSurinameSwazilandSwedenSwitzerlandSyrian Arab RepublicTajikistanTanzaniaThailandTimor-LesteTogoTongaTrinidad and TobagoTunisiaTurkeyTuvaluUgandaUkraineUnited KingdomUnited StatesUpper middle incomeUruguayVanuatuVenezuela, RBWest Bank and GazaWorldYemen, Rep.ZambiaZimbabwe Timeline:
This timeline shows a graph from 1976 to 2016 of Solomon Islands. No data until 1975. Number of actual observations by date: 41.
Source name:
World Development Indicators
Source organization:
International Monetary Fund, Balance of Payments Statistics Yearbook and data files.
Categories, topics:
Economy & Growth, Trade
Last updated:
apr 23, 2017
Indicators value changes by year
Minimum:
22.803
jan 1, 2005
Maximum:
83.685
jan 1, 1998
At the date of observation
Value
Absolute change
Change from previous value
jan 1, 1976
41.333
+41.333
0.0%
jan 1, 1977
43.243
+1.91
4.62%
jan 1, 1978
45.833
+2.59
5.99%
jan 1, 1979
59.211
+13.377
29.19%
jan 1, 1980
44.444
-14.766
-24.94%
jan 1, 1981
54.31
+9.866
22.2%
jan 1, 1982
59.756
+5.446
10.03%
jan 1, 1983
49.861
-9.895
-16.56%
jan 1, 1984
48.214
-1.646
-3.3%
jan 1, 1985
51.626
+3.412
7.08%
jan 1, 1986
51.33
-0.296
-0.57%
jan 1, 1987
59.148
+7.818
15.23%
jan 1, 1988
55.567
-3.582
-6.06%
jan 1, 1989
56.055
+0.488
0.88%
jan 1, 1990
55.272
-0.783
-1.4%
jan 1, 1991
59.196
+3.924
7.1%
jan 1, 1992
58.347
-0.849
-1.43%
jan 1, 1993
59.912
+1.565
2.68%
jan 1, 1994
77.566
+17.654
29.47%
jan 1, 1995
83.023
+5.457
7.03%
jan 1, 1996
74.466
-8.557
-10.31%
jan 1, 1997
76.312
+1.847
2.48%
jan 1, 1998
83.685
+7.372
9.66%
jan 1, 1999
55.788
-27.896
-33.34%
jan 1, 2000
29.27
-26.518
-47.53%
jan 1, 2001
32.756
+3.486
11.91%
jan 1, 2002
29.424
-3.332
-10.17%
jan 1, 2003
35.361
+5.938
20.18%
jan 1, 2004
48.364
+13.002
36.77%
jan 1, 2005
22.803
-25.561
-52.85%
jan 1, 2006
33.718
+10.914
47.86%
jan 1, 2007
23.61
-10.107
-29.98%
jan 1, 2008
27.861
+4.251
18.0%
jan 1, 2009
28.292
+0.431
1.55%
jan 1, 2010
28.336
+0.044
0.16%
jan 1, 2011
45.098
+16.762
59.16%
jan 1, 2012
32.502
-12.596
-27.93%
jan 1, 2013
37.328
+4.826
14.85%
jan 1, 2014
44.425
+7.098
19.02%
jan 1, 2015
37.719
-6.706
-15.09%
jan 1, 2016
32.458
-5.262
-13.95%
Ranking of countries by current statistics by years


Comments: