29
/
en
AIzaSyAYiBZKx7MnpbEhh9jyipgxe19OcubqV5w
April 1, 2024
262008
Thailand
THA
true
2
1
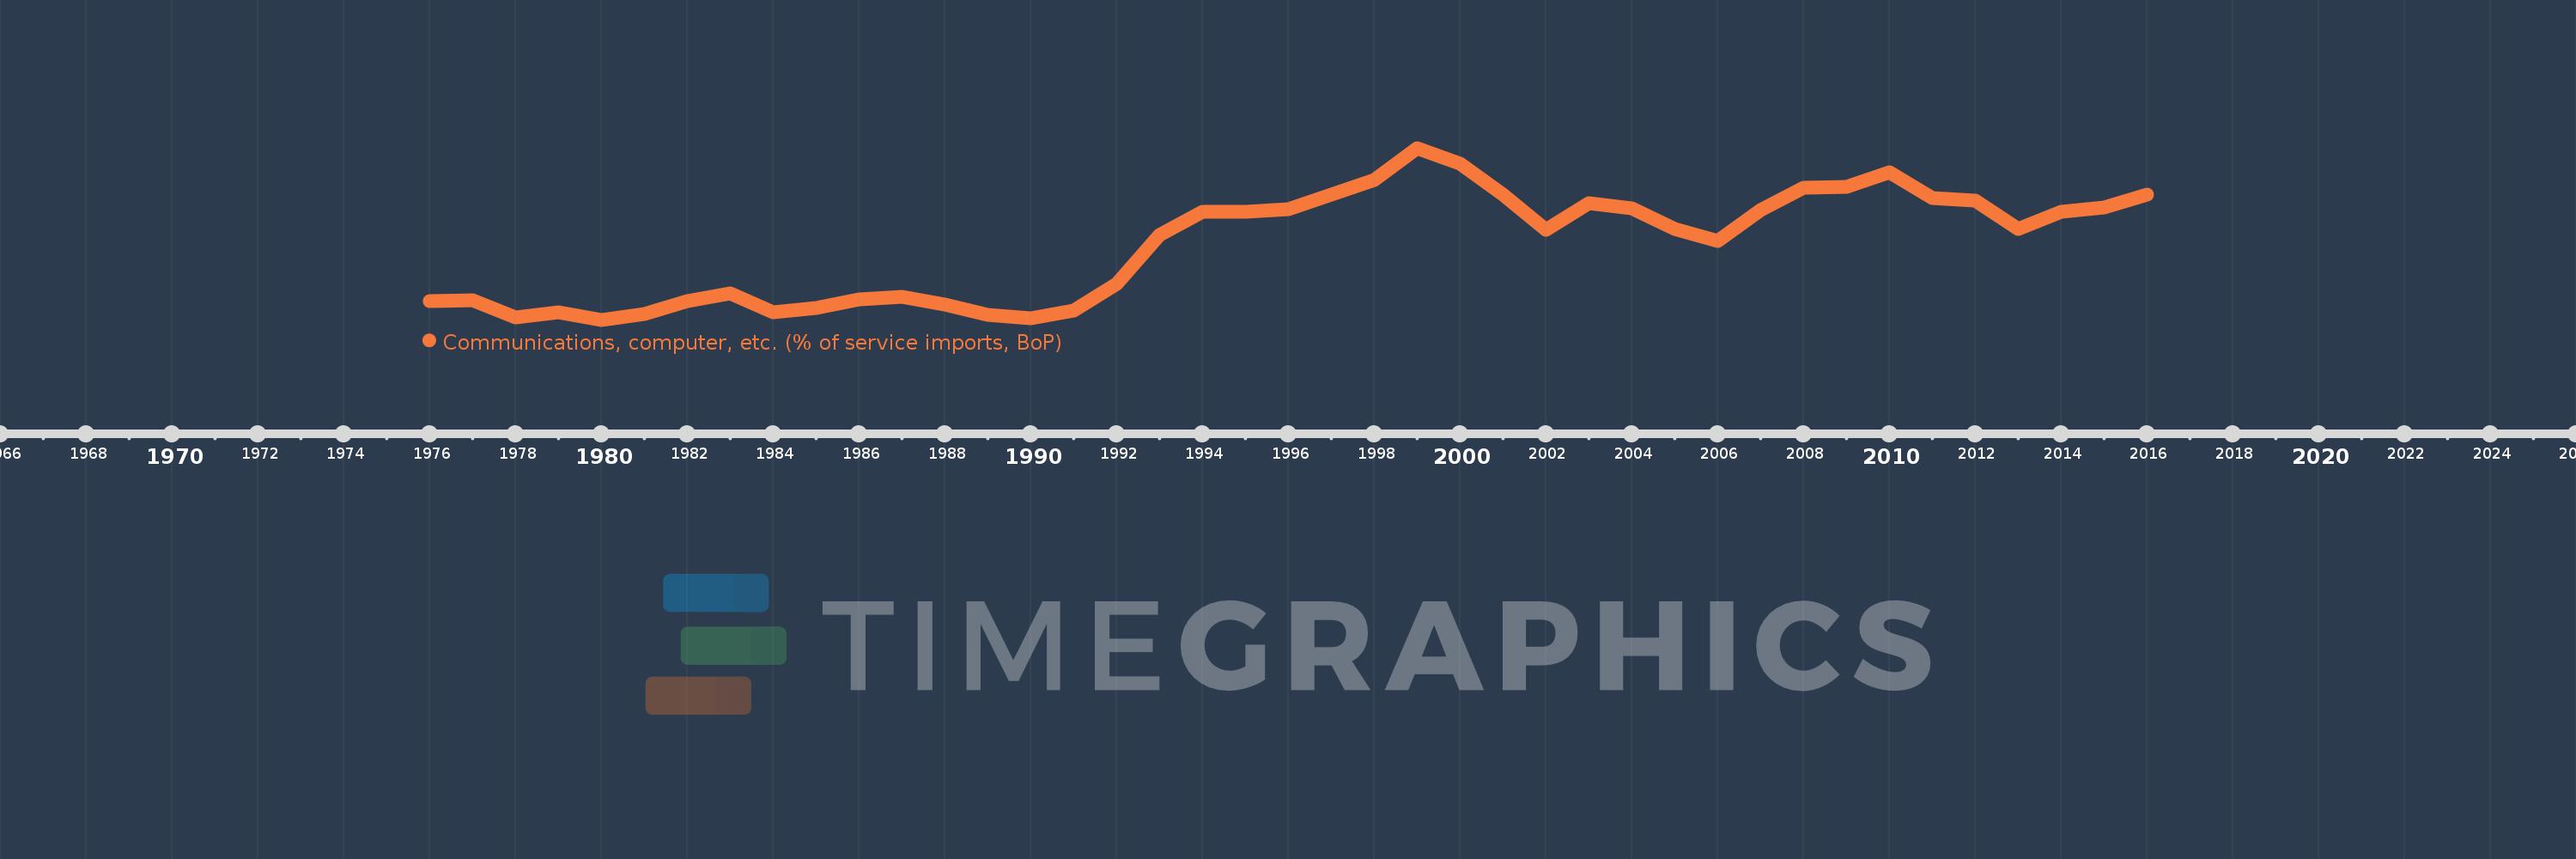
Communications, computer, etc. (% of service imports, BoP)
2016,2015,2014,2013,2012,2011,2010,2009,2008,2007,2006,2005,2004,2003,2002,2001,2000,1999,1998,1997,1996,1995,1994,1993,1992,1991,1990,1989,1988,1987,1986,1985,1984,1983,1982,1981,1980,1979,1978,1977,1976
This statistics in other country:
AfghanistanAlbaniaAlgeriaAngolaAntigua and BarbudaArab WorldArgentinaArmeniaArubaAustraliaAustriaAzerbaijanBahamas, TheBahrainBangladeshBarbadosBelarusBelgiumBelizeBeninBermudaBhutanBoliviaBosnia and HerzegovinaBotswanaBrazilBrunei DarussalamBulgariaBurkina FasoBurundiCabo VerdeCambodiaCameroonCanadaCaribbean small statesCentral African RepublicCentral Europe and the BalticsChadChileChinaColombiaComorosCongo, Dem. Rep.Congo, Rep.Costa RicaCote d'IvoireCroatiaCuracaoCyprusCzech RepublicDenmarkDjiboutiDominicaDominican RepublicEarly-demographic dividendEast Asia & PacificEast Asia & Pacific (excluding high income)East Asia & Pacific (IDA & IBRD countries)EcuadorEgypt, Arab Rep.El SalvadorEquatorial GuineaEritreaEstoniaEthiopiaEuro areaEurope & Central AsiaEurope & Central Asia (excluding high income)Europe & Central Asia (IDA & IBRD countries)European UnionFaroe IslandsFijiFinlandFragile and conflict affected situationsFranceFrench PolynesiaGabonGambia, TheGeorgiaGermanyGhanaGreeceGrenadaGuatemalaGuineaGuinea-BissauGuyanaHaitiHeavily indebted poor countries (HIPC)High incomeHondurasHong Kong SAR, ChinaHungaryIBRD onlyIcelandIDA & IBRD totalIDA onlyIDA totalIndiaIndonesiaIran, Islamic Rep.IraqIrelandIsraelItalyJamaicaJapanJordanKazakhstanKenyaKiribatiKorea, Rep.KosovoKuwaitKyrgyz RepublicLao PDRLate-demographic dividendLatin America & Caribbean Latin America & Caribbean (excluding high income)Latin America & the Caribbean (IDA & IBRD countries)LatviaLeast developed countries: UN classificationLebanonLesothoLiberiaLibyaLithuaniaLow & middle incomeLow incomeLower middle incomeLuxembourgMacao SAR, ChinaMacedonia, FYRMadagascarMalawiMalaysiaMaldivesMaliMaltaMarshall IslandsMauritaniaMauritiusMexicoMicronesia, Fed. Sts.Middle East & North AfricaMiddle East & North Africa (excluding high income)Middle East & North Africa (IDA & IBRD countries)Middle incomeMoldovaMongoliaMontenegroMoroccoMozambiqueMyanmarNamibiaNepalNetherlandsNew CaledoniaNew ZealandNicaraguaNigerNigeriaNorth AmericaNorwayOECD membersOmanOther small statesPacific island small statesPakistanPalauPanamaPapua New GuineaParaguayPeruPhilippinesPolandPortugalPost-demographic dividendPre-demographic dividendQatarRomaniaRussian FederationRwandaSamoaSao Tome and PrincipeSaudi ArabiaSenegalSerbiaSeychellesSierra LeoneSingaporeSint Maarten (Dutch part)Slovak RepublicSloveniaSmall statesSolomon IslandsSouth AfricaSouth AsiaSouth Asia (IDA & IBRD)South SudanSpainSri LankaSt. Kitts and NevisSt. LuciaSt. Vincent and the GrenadinesSub-Saharan Africa Sub-Saharan Africa (excluding high income)Sub-Saharan Africa (IDA & IBRD countries)SudanSurinameSwazilandSwedenSwitzerlandSyrian Arab RepublicTajikistanTanzaniaThailandTimor-LesteTogoTongaTrinidad and TobagoTunisiaTurkeyTuvaluUgandaUkraineUnited KingdomUnited StatesUpper middle incomeUruguayVanuatuVenezuela, RBWest Bank and GazaWorldYemen, Rep.ZambiaZimbabwe Timeline:
This timeline shows a graph from 1976 to 2016 of Thailand. No data until 1975. Number of actual observations by date: 41.
Source name:
World Development Indicators
Source organization:
International Monetary Fund, Balance of Payments Statistics Yearbook and data files.
Categories, topics:
Economy & Growth, Trade
Last updated:
apr 23, 2017
Indicators value changes by year
Maximum:
40.366
jan 1, 1999
At the date of observation
Value
Absolute change
Change from previous value
jan 1, 1976
16.806
+16.806
0.0%
jan 1, 1977
16.979
+0.173
1.03%
jan 1, 1978
14.362
-2.617
-15.41%
jan 1, 1979
15.085
+0.723
5.03%
jan 1, 1980
13.94
-1.144
-7.59%
jan 1, 1981
14.826
+0.885
6.35%
jan 1, 1982
16.851
+2.025
13.66%
jan 1, 1983
18.012
+1.161
6.89%
jan 1, 1984
15.109
-2.903
-16.12%
jan 1, 1985
15.787
+0.678
4.49%
jan 1, 1986
17.119
+1.333
8.44%
jan 1, 1987
17.53
+0.411
2.4%
jan 1, 1988
16.274
-1.256
-7.17%
jan 1, 1989
14.737
-1.537
-9.44%
jan 1, 1990
14.104
-0.633
-4.3%
jan 1, 1991
15.297
+1.193
8.46%
jan 1, 1992
19.478
+4.181
27.33%
jan 1, 1993
27.006
+7.528
38.65%
jan 1, 1994
30.557
+3.551
13.15%
jan 1, 1995
30.608
+0.051
0.17%
jan 1, 1996
30.903
+0.296
0.97%
jan 1, 1997
33.159
+2.256
7.3%
jan 1, 1998
35.475
+2.316
6.98%
jan 1, 1999
40.366
+4.891
13.79%
jan 1, 2000
37.911
-2.454
-6.08%
jan 1, 2001
33.16
-4.751
-12.53%
jan 1, 2002
27.735
-5.426
-16.36%
jan 1, 2003
31.844
+4.109
14.82%
jan 1, 2004
31.037
-0.807
-2.53%
jan 1, 2005
27.919
-3.118
-10.05%
jan 1, 2006
26.021
-1.898
-6.8%
jan 1, 2007
30.783
+4.762
18.3%
jan 1, 2008
34.203
+3.42
11.11%
jan 1, 2009
34.342
+0.139
0.41%
jan 1, 2010
36.561
+2.218
6.46%
jan 1, 2011
32.612
-3.949
-10.8%
jan 1, 2012
32.208
-0.404
-1.24%
jan 1, 2013
27.941
-4.267
-13.25%
jan 1, 2014
30.504
+2.563
9.17%
jan 1, 2015
31.164
+0.66
2.17%
jan 1, 2016
33.126
+1.961
6.29%
Ranking of countries by current statistics by years


Comments: