29
/
en
AIzaSyAYiBZKx7MnpbEhh9jyipgxe19OcubqV5w
April 1, 2024
42192
Latin America & Caribbean (excluding high income)
LAC
false
2
1
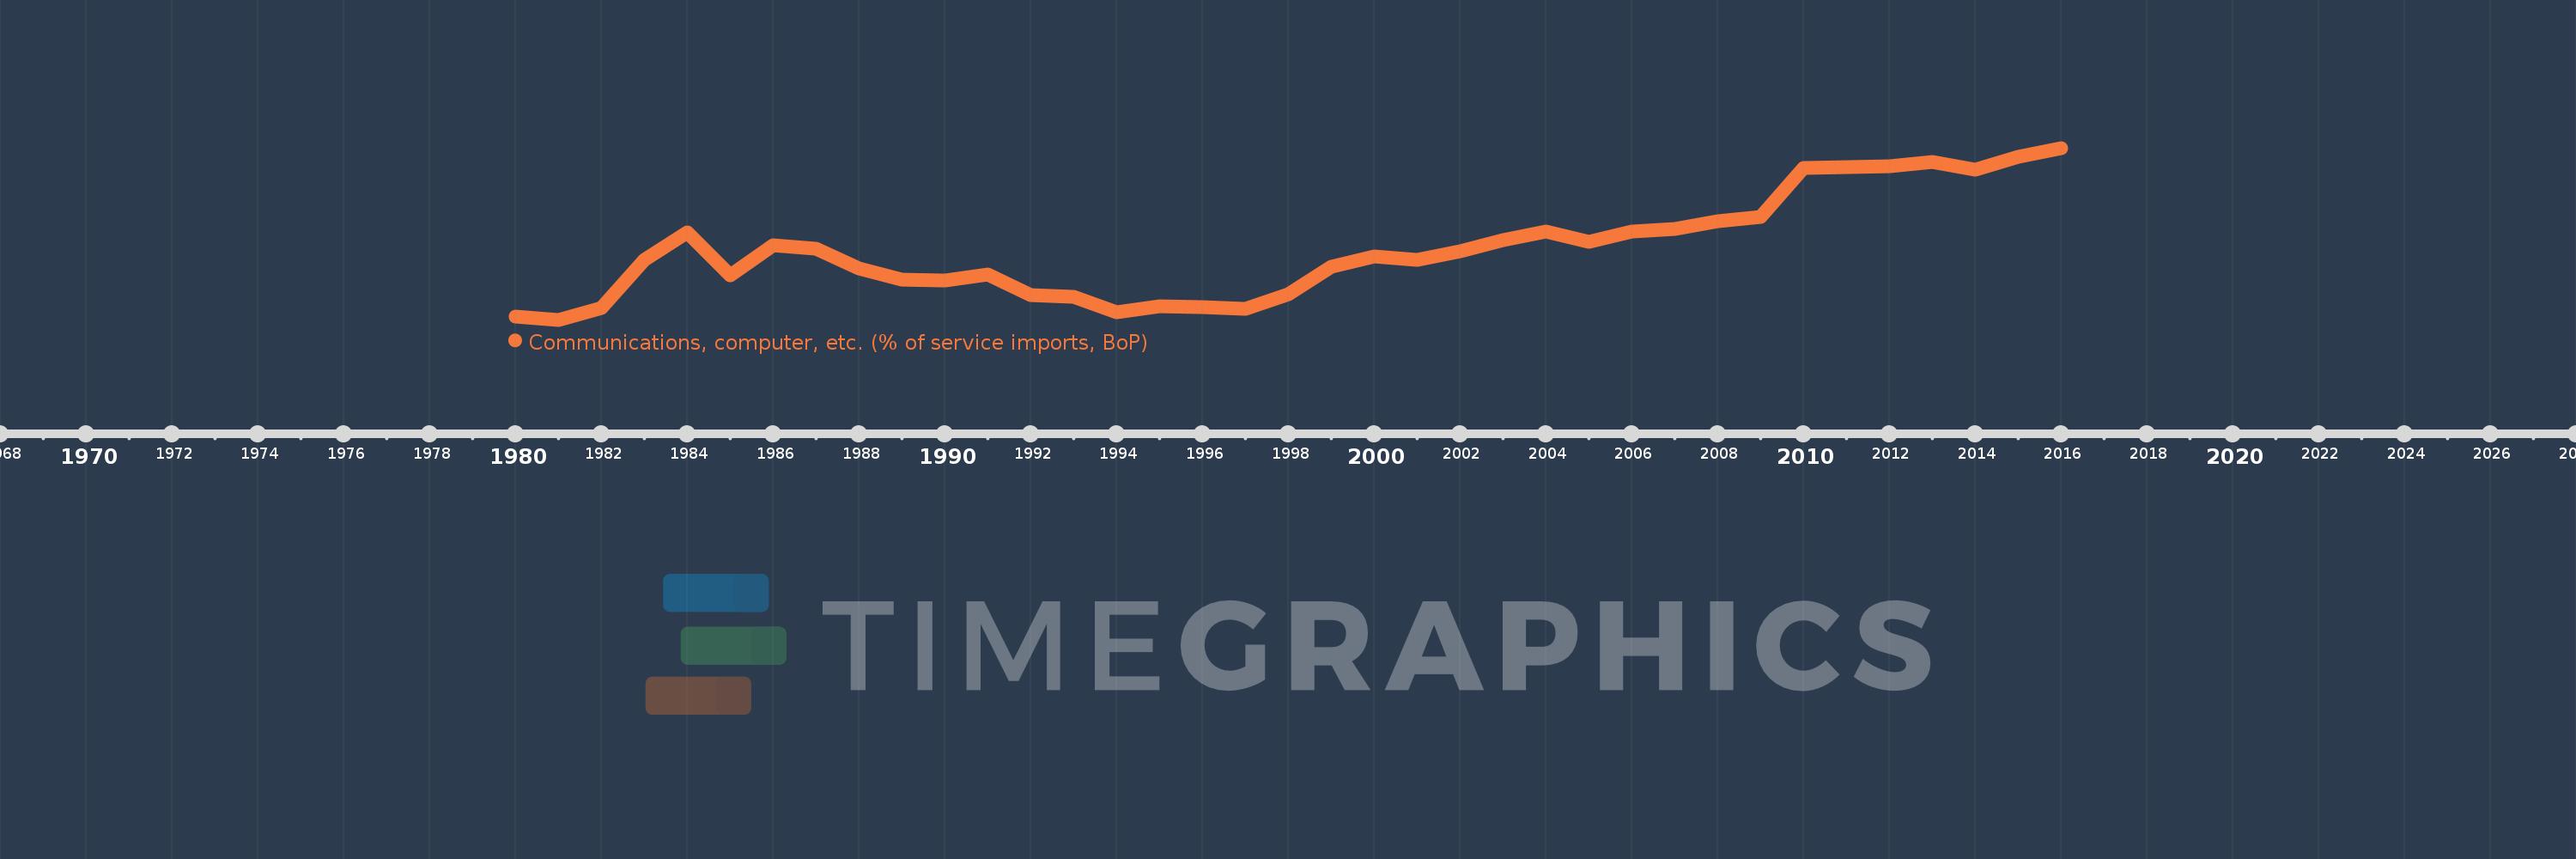
Communications, computer, etc. (% of service imports, BoP)
2016,2015,2014,2013,2012,2011,2010,2009,2008,2007,2006,2005,2004,2003,2002,2001,2000,1999,1998,1997,1996,1995,1994,1993,1992,1991,1990,1989,1988,1987,1986,1985,1984,1983,1982,1981,1980
This statistics in other country:
AfghanistanAlbaniaAlgeriaAngolaAntigua and BarbudaArab WorldArgentinaArmeniaArubaAustraliaAustriaAzerbaijanBahamas, TheBahrainBangladeshBarbadosBelarusBelgiumBelizeBeninBermudaBhutanBoliviaBosnia and HerzegovinaBotswanaBrazilBrunei DarussalamBulgariaBurkina FasoBurundiCabo VerdeCambodiaCameroonCanadaCaribbean small statesCentral African RepublicCentral Europe and the BalticsChadChileChinaColombiaComorosCongo, Dem. Rep.Congo, Rep.Costa RicaCote d'IvoireCroatiaCuracaoCyprusCzech RepublicDenmarkDjiboutiDominicaDominican RepublicEarly-demographic dividendEast Asia & PacificEast Asia & Pacific (excluding high income)East Asia & Pacific (IDA & IBRD countries)EcuadorEgypt, Arab Rep.El SalvadorEquatorial GuineaEritreaEstoniaEthiopiaEuro areaEurope & Central AsiaEurope & Central Asia (excluding high income)Europe & Central Asia (IDA & IBRD countries)European UnionFaroe IslandsFijiFinlandFragile and conflict affected situationsFranceFrench PolynesiaGabonGambia, TheGeorgiaGermanyGhanaGreeceGrenadaGuatemalaGuineaGuinea-BissauGuyanaHaitiHeavily indebted poor countries (HIPC)High incomeHondurasHong Kong SAR, ChinaHungaryIBRD onlyIcelandIDA & IBRD totalIDA onlyIDA totalIndiaIndonesiaIran, Islamic Rep.IraqIrelandIsraelItalyJamaicaJapanJordanKazakhstanKenyaKiribatiKorea, Rep.KosovoKuwaitKyrgyz RepublicLao PDRLate-demographic dividendLatin America & Caribbean Latin America & Caribbean (excluding high income)Latin America & the Caribbean (IDA & IBRD countries)LatviaLeast developed countries: UN classificationLebanonLesothoLiberiaLibyaLithuaniaLow & middle incomeLow incomeLower middle incomeLuxembourgMacao SAR, ChinaMacedonia, FYRMadagascarMalawiMalaysiaMaldivesMaliMaltaMarshall IslandsMauritaniaMauritiusMexicoMicronesia, Fed. Sts.Middle East & North AfricaMiddle East & North Africa (excluding high income)Middle East & North Africa (IDA & IBRD countries)Middle incomeMoldovaMongoliaMontenegroMoroccoMozambiqueMyanmarNamibiaNepalNetherlandsNew CaledoniaNew ZealandNicaraguaNigerNigeriaNorth AmericaNorwayOECD membersOmanOther small statesPacific island small statesPakistanPalauPanamaPapua New GuineaParaguayPeruPhilippinesPolandPortugalPost-demographic dividendPre-demographic dividendQatarRomaniaRussian FederationRwandaSamoaSao Tome and PrincipeSaudi ArabiaSenegalSerbiaSeychellesSierra LeoneSingaporeSint Maarten (Dutch part)Slovak RepublicSloveniaSmall statesSolomon IslandsSouth AfricaSouth AsiaSouth Asia (IDA & IBRD)South SudanSpainSri LankaSt. Kitts and NevisSt. LuciaSt. Vincent and the GrenadinesSub-Saharan Africa Sub-Saharan Africa (excluding high income)Sub-Saharan Africa (IDA & IBRD countries)SudanSurinameSwazilandSwedenSwitzerlandSyrian Arab RepublicTajikistanTanzaniaThailandTimor-LesteTogoTongaTrinidad and TobagoTunisiaTurkeyTuvaluUgandaUkraineUnited KingdomUnited StatesUpper middle incomeUruguayVanuatuVenezuela, RBWest Bank and GazaWorldYemen, Rep.ZambiaZimbabwe Timeline:
This timeline shows a graph from 1980 to 2016 of Latin America & Caribbean (excluding high income). No data until 1979. Number of actual observations by date: 37.
Source name:
World Development Indicators
Source organization:
International Monetary Fund, Balance of Payments Statistics Yearbook and data files.
Categories, topics:
Economy & Growth, Trade
Last updated:
apr 23, 2017
Indicators value changes by year
Minimum:
21.392
jan 1, 1981
Maximum:
39.019
jan 1, 2016
At the date of observation
Value
Absolute change
Change from previous value
jan 1, 1980
21.691
+21.691
0.0%
jan 1, 1981
21.392
-0.299
-1.38%
jan 1, 1982
22.573
+1.181
5.52%
jan 1, 1983
27.542
+4.969
22.02%
jan 1, 1984
30.334
+2.792
10.14%
jan 1, 1985
25.978
-4.356
-14.36%
jan 1, 1986
29.072
+3.094
11.91%
jan 1, 1987
28.671
-0.401
-1.38%
jan 1, 1988
26.684
-1.987
-6.93%
jan 1, 1989
25.55
-1.134
-4.25%
jan 1, 1990
25.385
-0.166
-0.65%
jan 1, 1991
26.023
+0.639
2.52%
jan 1, 1992
23.936
-2.087
-8.02%
jan 1, 1993
23.742
-0.194
-0.81%
jan 1, 1994
22.164
-1.578
-6.64%
jan 1, 1995
22.811
+0.646
2.92%
jan 1, 1996
22.702
-0.109
-0.48%
jan 1, 1997
22.486
-0.216
-0.95%
jan 1, 1998
23.987
+1.501
6.68%
jan 1, 1999
26.789
+2.801
11.68%
jan 1, 2000
27.89
+1.101
4.11%
jan 1, 2001
27.533
-0.357
-1.28%
jan 1, 2002
28.396
+0.864
3.14%
jan 1, 2003
29.568
+1.172
4.13%
jan 1, 2004
30.474
+0.906
3.06%
jan 1, 2005
29.428
-1.046
-3.43%
jan 1, 2006
30.445
+1.017
3.46%
jan 1, 2007
30.668
+0.223
0.73%
jan 1, 2008
31.515
+0.847
2.76%
jan 1, 2009
31.929
+0.414
1.31%
jan 1, 2010
36.944
+5.015
15.71%
jan 1, 2011
37.084
+0.14
0.38%
jan 1, 2012
37.165
+0.081
0.22%
jan 1, 2013
37.559
+0.394
1.06%
jan 1, 2014
36.768
-0.791
-2.11%
jan 1, 2015
38.153
+1.385
3.77%
jan 1, 2016
39.019
+0.866
2.27%
Ranking of countries by current statistics by years


Comments: