29
/
en
AIzaSyAYiBZKx7MnpbEhh9jyipgxe19OcubqV5w
April 1, 2024
179823
Libya
LBY
true
2
1
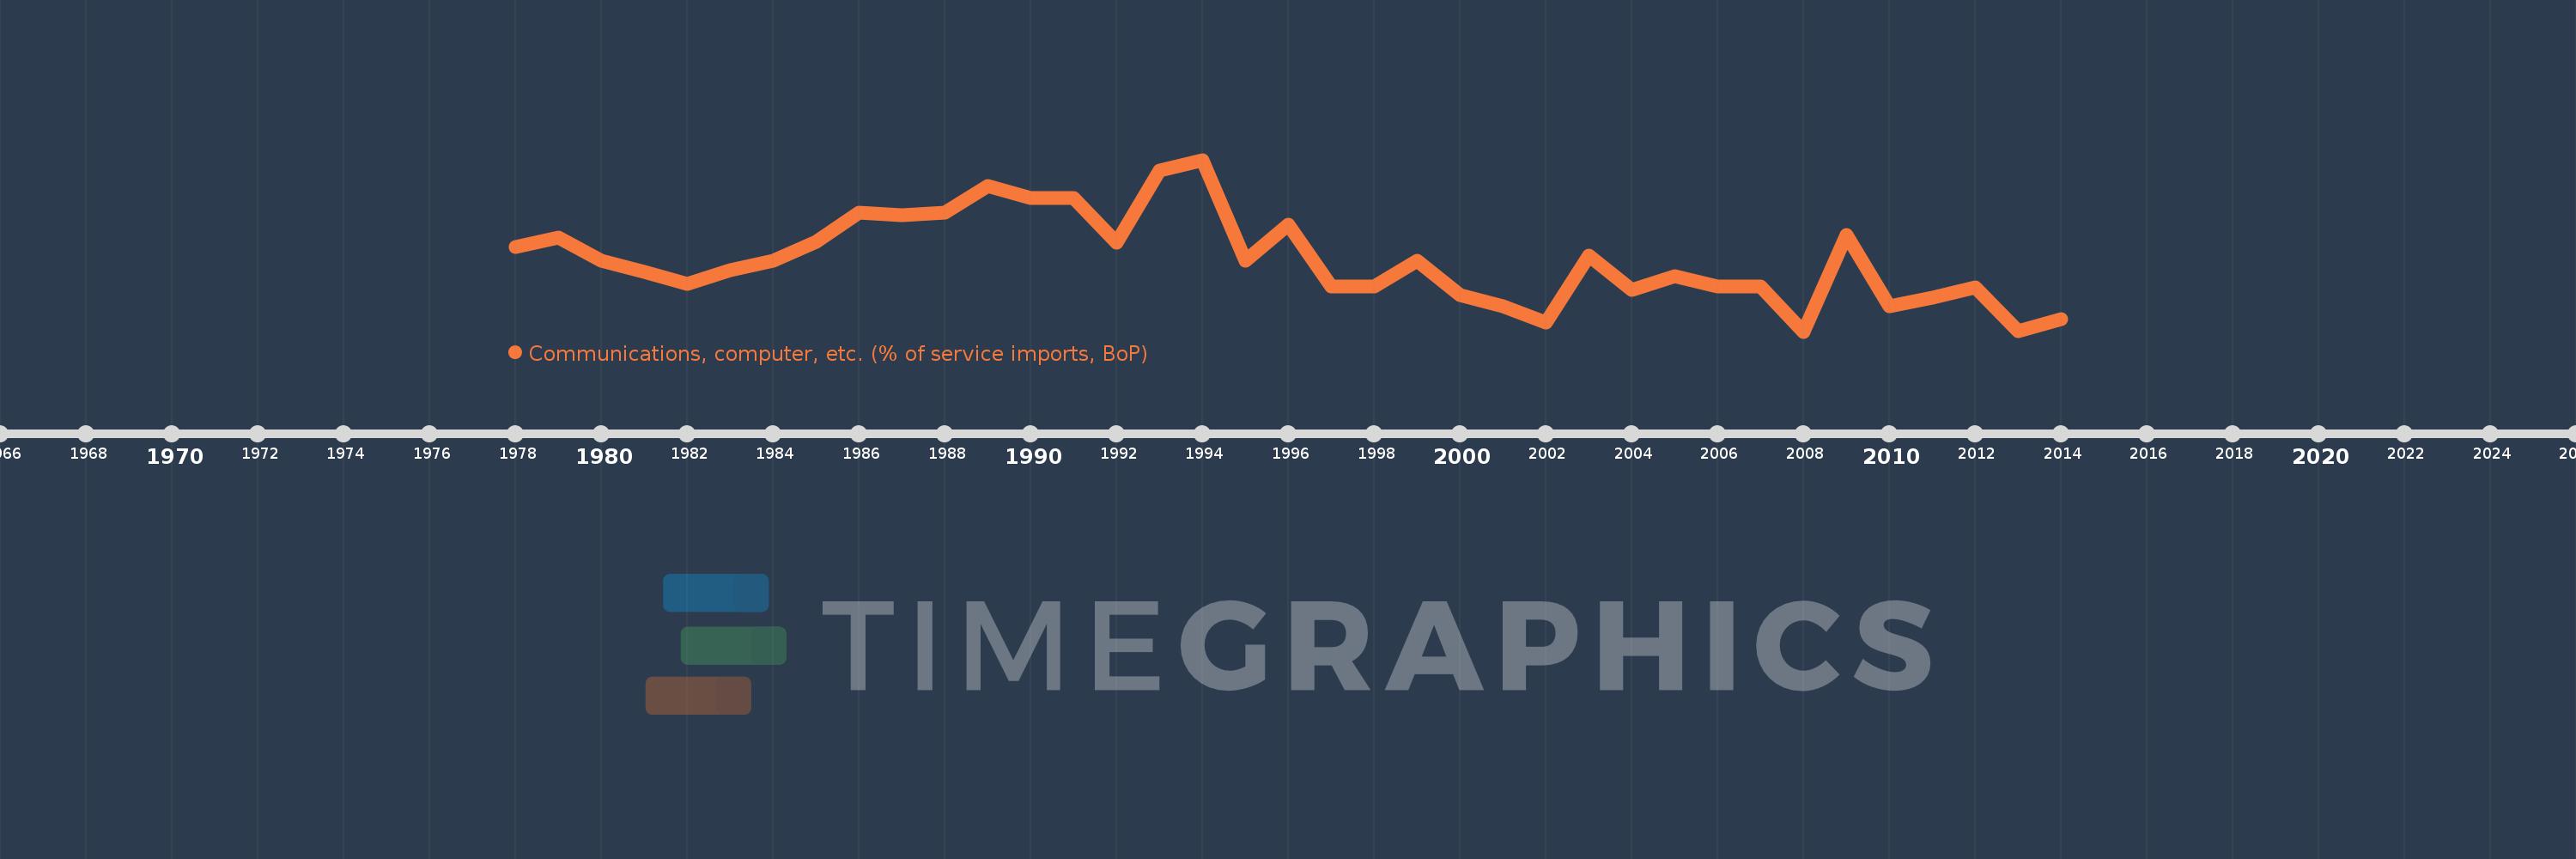
Communications, computer, etc. (% of service imports, BoP)
2014,2013,2012,2011,2010,2009,2008,2007,2006,2005,2004,2003,2002,2001,2000,1999,1998,1997,1996,1995,1994,1993,1992,1991,1990,1989,1988,1987,1986,1985,1984,1983,1982,1981,1980,1979,1978
This statistics in other country:
AfghanistanAlbaniaAlgeriaAngolaAntigua and BarbudaArab WorldArgentinaArmeniaArubaAustraliaAustriaAzerbaijanBahamas, TheBahrainBangladeshBarbadosBelarusBelgiumBelizeBeninBermudaBhutanBoliviaBosnia and HerzegovinaBotswanaBrazilBrunei DarussalamBulgariaBurkina FasoBurundiCabo VerdeCambodiaCameroonCanadaCaribbean small statesCentral African RepublicCentral Europe and the BalticsChadChileChinaColombiaComorosCongo, Dem. Rep.Congo, Rep.Costa RicaCote d'IvoireCroatiaCuracaoCyprusCzech RepublicDenmarkDjiboutiDominicaDominican RepublicEarly-demographic dividendEast Asia & PacificEast Asia & Pacific (excluding high income)East Asia & Pacific (IDA & IBRD countries)EcuadorEgypt, Arab Rep.El SalvadorEquatorial GuineaEritreaEstoniaEthiopiaEuro areaEurope & Central AsiaEurope & Central Asia (excluding high income)Europe & Central Asia (IDA & IBRD countries)European UnionFaroe IslandsFijiFinlandFragile and conflict affected situationsFranceFrench PolynesiaGabonGambia, TheGeorgiaGermanyGhanaGreeceGrenadaGuatemalaGuineaGuinea-BissauGuyanaHaitiHeavily indebted poor countries (HIPC)High incomeHondurasHong Kong SAR, ChinaHungaryIBRD onlyIcelandIDA & IBRD totalIDA onlyIDA totalIndiaIndonesiaIran, Islamic Rep.IraqIrelandIsraelItalyJamaicaJapanJordanKazakhstanKenyaKiribatiKorea, Rep.KosovoKuwaitKyrgyz RepublicLao PDRLate-demographic dividendLatin America & Caribbean Latin America & Caribbean (excluding high income)Latin America & the Caribbean (IDA & IBRD countries)LatviaLeast developed countries: UN classificationLebanonLesothoLiberiaLibyaLithuaniaLow & middle incomeLow incomeLower middle incomeLuxembourgMacao SAR, ChinaMacedonia, FYRMadagascarMalawiMalaysiaMaldivesMaliMaltaMarshall IslandsMauritaniaMauritiusMexicoMicronesia, Fed. Sts.Middle East & North AfricaMiddle East & North Africa (excluding high income)Middle East & North Africa (IDA & IBRD countries)Middle incomeMoldovaMongoliaMontenegroMoroccoMozambiqueMyanmarNamibiaNepalNetherlandsNew CaledoniaNew ZealandNicaraguaNigerNigeriaNorth AmericaNorwayOECD membersOmanOther small statesPacific island small statesPakistanPalauPanamaPapua New GuineaParaguayPeruPhilippinesPolandPortugalPost-demographic dividendPre-demographic dividendQatarRomaniaRussian FederationRwandaSamoaSao Tome and PrincipeSaudi ArabiaSenegalSerbiaSeychellesSierra LeoneSingaporeSint Maarten (Dutch part)Slovak RepublicSloveniaSmall statesSolomon IslandsSouth AfricaSouth AsiaSouth Asia (IDA & IBRD)South SudanSpainSri LankaSt. Kitts and NevisSt. LuciaSt. Vincent and the GrenadinesSub-Saharan Africa Sub-Saharan Africa (excluding high income)Sub-Saharan Africa (IDA & IBRD countries)SudanSurinameSwazilandSwedenSwitzerlandSyrian Arab RepublicTajikistanTanzaniaThailandTimor-LesteTogoTongaTrinidad and TobagoTunisiaTurkeyTuvaluUgandaUkraineUnited KingdomUnited StatesUpper middle incomeUruguayVanuatuVenezuela, RBWest Bank and GazaWorldYemen, Rep.ZambiaZimbabwe Timeline:
This timeline shows a graph from 1978 to 2014 of Libya. No data until 1977. Number of actual observations by date: 37.
Source name:
World Development Indicators
Source organization:
International Monetary Fund, Balance of Payments Statistics Yearbook and data files.
Categories, topics:
Economy & Growth, Trade
Last updated:
apr 23, 2017
Indicators value changes by year
Minimum:
10.735
jan 1, 2008
Maximum:
46.627
jan 1, 1994
At the date of observation
Value
Absolute change
Change from previous value
jan 1, 1978
28.427
+28.427
0.0%
jan 1, 1979
30.41
+1.984
6.98%
jan 1, 1980
25.545
-4.866
-16.0%
jan 1, 1981
23.233
-2.312
-9.05%
jan 1, 1982
20.74
-2.493
-10.73%
jan 1, 1983
23.65
+2.911
14.03%
jan 1, 1984
25.518
+1.867
7.9%
jan 1, 1985
29.479
+3.961
15.52%
jan 1, 1986
35.668
+6.19
21.0%
jan 1, 1987
35.082
-0.586
-1.64%
jan 1, 1988
35.546
+0.464
1.32%
jan 1, 1989
41.116
+5.571
15.67%
jan 1, 1990
38.72
-2.396
-5.83%
jan 1, 1991
38.695
-0.025
-0.06%
jan 1, 1992
29.268
-9.427
-24.36%
jan 1, 1993
44.359
+15.091
51.56%
jan 1, 1994
46.627
+2.268
5.11%
jan 1, 1995
25.529
-21.098
-45.25%
jan 1, 1996
33.125
+7.596
29.75%
jan 1, 1997
20.154
-12.971
-39.16%
jan 1, 1998
20.168
+0.014
0.07%
jan 1, 1999
25.509
+5.341
26.48%
jan 1, 2000
18.404
-7.105
-27.85%
jan 1, 2001
15.978
-2.426
-13.18%
jan 1, 2002
12.669
-3.308
-20.71%
jan 1, 2003
26.684
+14.015
110.62%
jan 1, 2004
19.411
-7.273
-27.25%
jan 1, 2005
22.362
+2.95
15.2%
jan 1, 2006
20.136
-2.225
-9.95%
jan 1, 2007
20.125
-0.011
-0.06%
jan 1, 2008
10.735
-9.39
-46.66%
jan 1, 2009
30.841
+20.106
187.29%
jan 1, 2010
16.05
-14.791
-47.96%
jan 1, 2011
17.779
+1.729
10.78%
jan 1, 2012
19.898
+2.119
11.92%
jan 1, 2013
10.826
-9.072
-45.59%
jan 1, 2014
13.397
+2.57
23.74%
Ranking of countries by current statistics by years


Comments: