29
/
en
AIzaSyAYiBZKx7MnpbEhh9jyipgxe19OcubqV5w
April 1, 2024
148937
Haiti
HTI
true
2
1
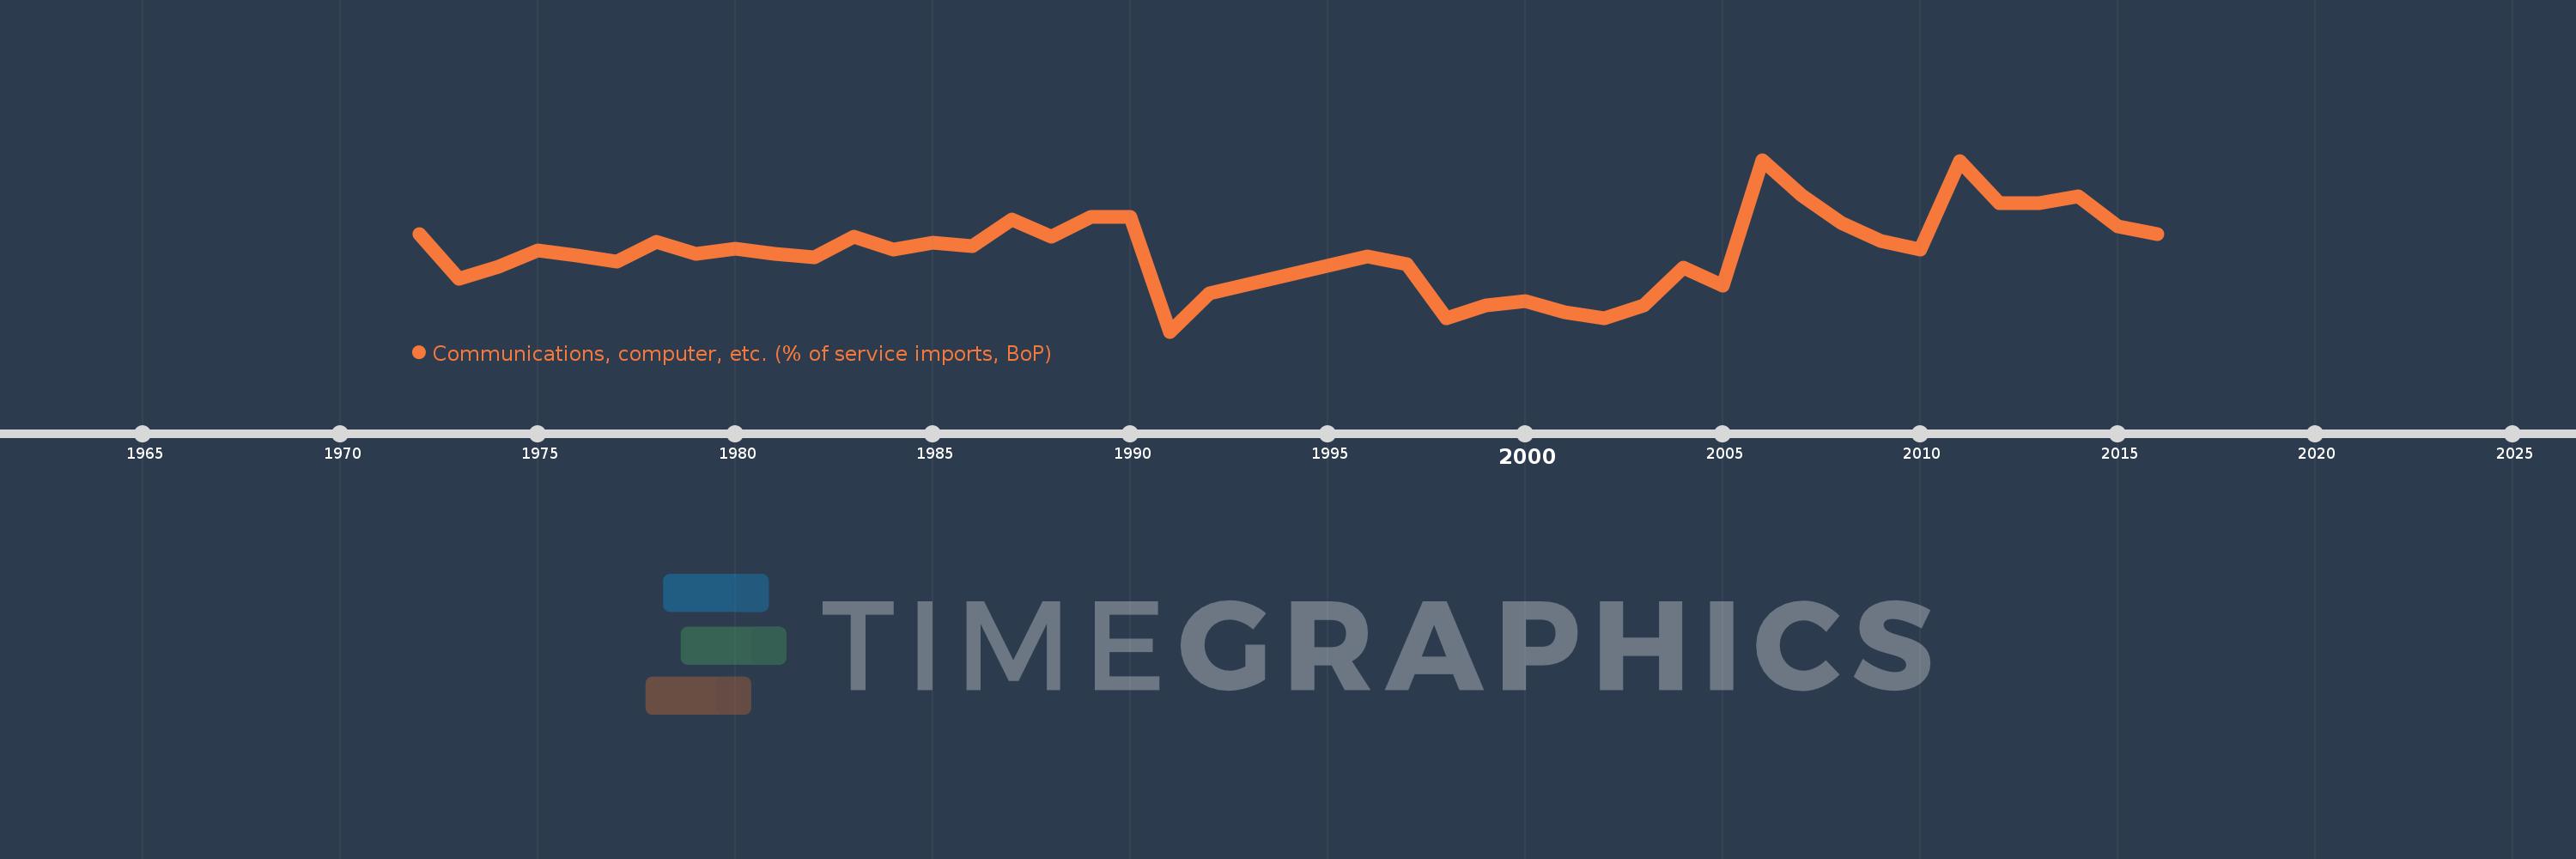
Communications, computer, etc. (% of service imports, BoP)
2016,2015,2014,2013,2012,2011,2010,2009,2008,2007,2006,2005,2004,2003,2002,2001,2000,1999,1998,1997,1996,1992,1991,1990,1989,1988,1987,1986,1985,1984,1983,1982,1981,1980,1979,1978,1977,1976,1975,1974,1973,1972
This statistics in other country:
AfghanistanAlbaniaAlgeriaAngolaAntigua and BarbudaArab WorldArgentinaArmeniaArubaAustraliaAustriaAzerbaijanBahamas, TheBahrainBangladeshBarbadosBelarusBelgiumBelizeBeninBermudaBhutanBoliviaBosnia and HerzegovinaBotswanaBrazilBrunei DarussalamBulgariaBurkina FasoBurundiCabo VerdeCambodiaCameroonCanadaCaribbean small statesCentral African RepublicCentral Europe and the BalticsChadChileChinaColombiaComorosCongo, Dem. Rep.Congo, Rep.Costa RicaCote d'IvoireCroatiaCuracaoCyprusCzech RepublicDenmarkDjiboutiDominicaDominican RepublicEarly-demographic dividendEast Asia & PacificEast Asia & Pacific (excluding high income)East Asia & Pacific (IDA & IBRD countries)EcuadorEgypt, Arab Rep.El SalvadorEquatorial GuineaEritreaEstoniaEthiopiaEuro areaEurope & Central AsiaEurope & Central Asia (excluding high income)Europe & Central Asia (IDA & IBRD countries)European UnionFaroe IslandsFijiFinlandFragile and conflict affected situationsFranceFrench PolynesiaGabonGambia, TheGeorgiaGermanyGhanaGreeceGrenadaGuatemalaGuineaGuinea-BissauGuyanaHaitiHeavily indebted poor countries (HIPC)High incomeHondurasHong Kong SAR, ChinaHungaryIBRD onlyIcelandIDA & IBRD totalIDA onlyIDA totalIndiaIndonesiaIran, Islamic Rep.IraqIrelandIsraelItalyJamaicaJapanJordanKazakhstanKenyaKiribatiKorea, Rep.KosovoKuwaitKyrgyz RepublicLao PDRLate-demographic dividendLatin America & Caribbean Latin America & Caribbean (excluding high income)Latin America & the Caribbean (IDA & IBRD countries)LatviaLeast developed countries: UN classificationLebanonLesothoLiberiaLibyaLithuaniaLow & middle incomeLow incomeLower middle incomeLuxembourgMacao SAR, ChinaMacedonia, FYRMadagascarMalawiMalaysiaMaldivesMaliMaltaMarshall IslandsMauritaniaMauritiusMexicoMicronesia, Fed. Sts.Middle East & North AfricaMiddle East & North Africa (excluding high income)Middle East & North Africa (IDA & IBRD countries)Middle incomeMoldovaMongoliaMontenegroMoroccoMozambiqueMyanmarNamibiaNepalNetherlandsNew CaledoniaNew ZealandNicaraguaNigerNigeriaNorth AmericaNorwayOECD membersOmanOther small statesPacific island small statesPakistanPalauPanamaPapua New GuineaParaguayPeruPhilippinesPolandPortugalPost-demographic dividendPre-demographic dividendQatarRomaniaRussian FederationRwandaSamoaSao Tome and PrincipeSaudi ArabiaSenegalSerbiaSeychellesSierra LeoneSingaporeSint Maarten (Dutch part)Slovak RepublicSloveniaSmall statesSolomon IslandsSouth AfricaSouth AsiaSouth Asia (IDA & IBRD)South SudanSpainSri LankaSt. Kitts and NevisSt. LuciaSt. Vincent and the GrenadinesSub-Saharan Africa Sub-Saharan Africa (excluding high income)Sub-Saharan Africa (IDA & IBRD countries)SudanSurinameSwazilandSwedenSwitzerlandSyrian Arab RepublicTajikistanTanzaniaThailandTimor-LesteTogoTongaTrinidad and TobagoTunisiaTurkeyTuvaluUgandaUkraineUnited KingdomUnited StatesUpper middle incomeUruguayVanuatuVenezuela, RBWest Bank and GazaWorldYemen, Rep.ZambiaZimbabwe Timeline:
This timeline shows a graph from 1972 to 2016 of Haiti. No data until 1971. Number of actual observations by date: 42.
Source name:
World Development Indicators
Source organization:
International Monetary Fund, Balance of Payments Statistics Yearbook and data files.
Categories, topics:
Economy & Growth, Trade
Last updated:
apr 23, 2017
Indicators value changes by year
Maximum:
48.838
jan 1, 2006
At the date of observation
Value
Absolute change
Change from previous value
jan 1, 1972
28.243
+28.243
0.0%
jan 1, 1973
16.007
-12.236
-43.32%
jan 1, 1974
19.259
+3.252
20.31%
jan 1, 1975
23.888
+4.629
24.04%
jan 1, 1976
22.347
-1.54
-6.45%
jan 1, 1977
20.614
-1.733
-7.76%
jan 1, 1978
26.141
+5.527
26.81%
jan 1, 1979
22.968
-3.173
-12.14%
jan 1, 1980
24.175
+1.207
5.26%
jan 1, 1981
22.956
-1.219
-5.04%
jan 1, 1982
22.025
-0.931
-4.06%
jan 1, 1983
27.587
+5.562
25.25%
jan 1, 1984
24.049
-3.538
-12.83%
jan 1, 1985
25.912
+1.864
7.75%
jan 1, 1986
25.04
-0.872
-3.37%
jan 1, 1987
32.437
+7.397
29.54%
jan 1, 1988
27.535
-4.901
-15.11%
jan 1, 1989
33.178
+5.643
20.49%
jan 1, 1990
32.949
-0.229
-0.69%
jan 1, 1991
1.389
-31.56
-95.78%
jan 1, 1992
12.005
+10.616
764.35%
jan 1, 1996
22.077
+10.072
83.9%
jan 1, 1997
20.122
-1.954
-8.85%
jan 1, 1998
5.158
-14.964
-74.36%
jan 1, 1999
8.697
+3.539
68.6%
jan 1, 2000
9.805
+1.108
12.73%
jan 1, 2001
6.738
-3.067
-31.28%
jan 1, 2002
5.183
-1.554
-23.07%
jan 1, 2003
8.697
+3.514
67.8%
jan 1, 2004
19.089
+10.391
119.48%
jan 1, 2005
14.18
-4.909
-25.72%
jan 1, 2006
48.838
+34.658
244.41%
jan 1, 2007
39.067
-9.771
-20.01%
jan 1, 2008
31.436
-7.632
-19.54%
jan 1, 2009
26.466
-4.97
-15.81%
jan 1, 2010
24.131
-2.335
-8.82%
jan 1, 2011
48.44
+24.308
100.73%
jan 1, 2012
36.761
-11.678
-24.11%
jan 1, 2013
36.858
+0.097
0.26%
jan 1, 2014
38.645
+1.787
4.85%
jan 1, 2015
30.391
-8.254
-21.36%
jan 1, 2016
28.335
-2.055
-6.76%
Ranking of countries by current statistics by years


Comments: