29
/
en
AIzaSyAYiBZKx7MnpbEhh9jyipgxe19OcubqV5w
April 1, 2024
177461
Lesotho
LSO
true
2
1
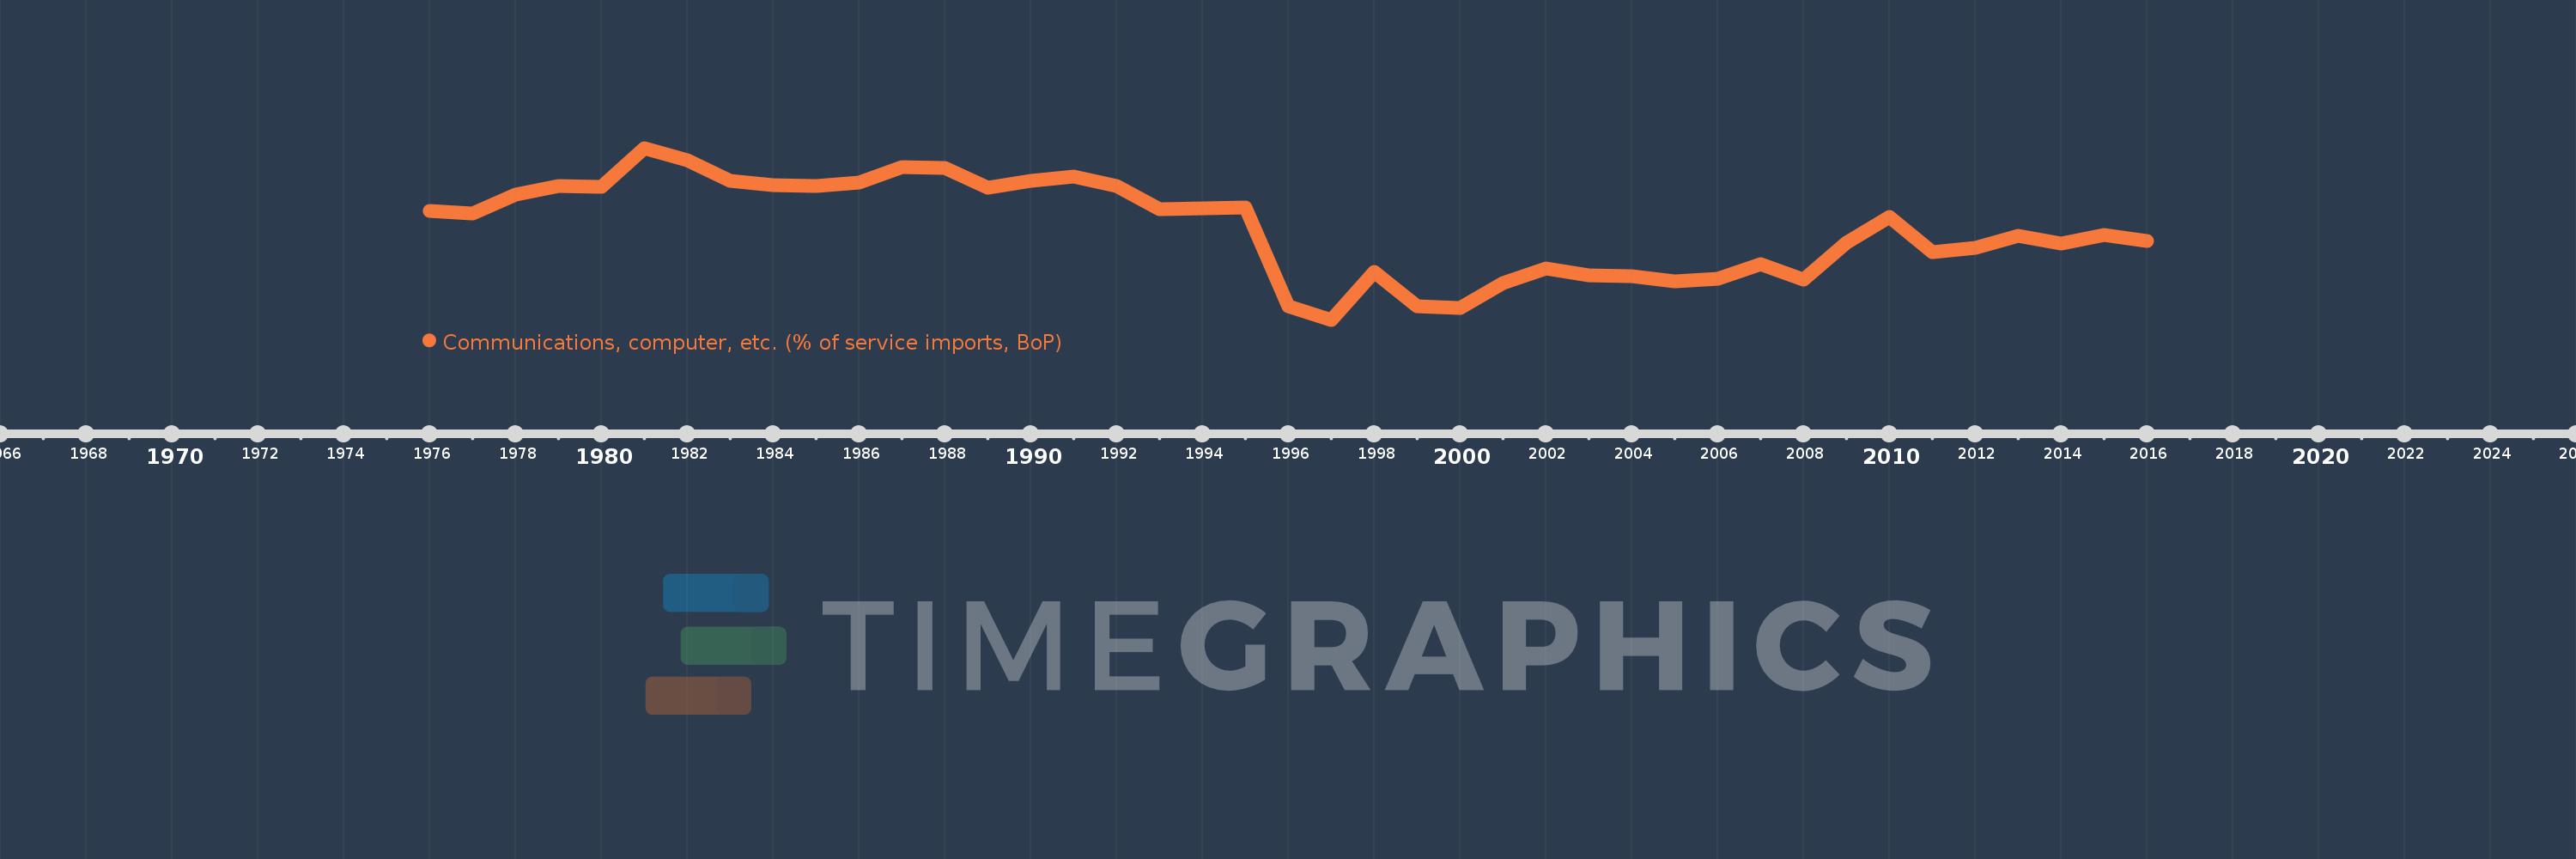
Communications, computer, etc. (% of service imports, BoP)
2016,2015,2014,2013,2012,2011,2010,2009,2008,2007,2006,2005,2004,2003,2002,2001,2000,1999,1998,1997,1996,1995,1994,1993,1992,1991,1990,1989,1988,1987,1986,1985,1984,1983,1982,1981,1980,1979,1978,1977,1976
This statistics in other country:
AfghanistanAlbaniaAlgeriaAngolaAntigua and BarbudaArab WorldArgentinaArmeniaArubaAustraliaAustriaAzerbaijanBahamas, TheBahrainBangladeshBarbadosBelarusBelgiumBelizeBeninBermudaBhutanBoliviaBosnia and HerzegovinaBotswanaBrazilBrunei DarussalamBulgariaBurkina FasoBurundiCabo VerdeCambodiaCameroonCanadaCaribbean small statesCentral African RepublicCentral Europe and the BalticsChadChileChinaColombiaComorosCongo, Dem. Rep.Congo, Rep.Costa RicaCote d'IvoireCroatiaCuracaoCyprusCzech RepublicDenmarkDjiboutiDominicaDominican RepublicEarly-demographic dividendEast Asia & PacificEast Asia & Pacific (excluding high income)East Asia & Pacific (IDA & IBRD countries)EcuadorEgypt, Arab Rep.El SalvadorEquatorial GuineaEritreaEstoniaEthiopiaEuro areaEurope & Central AsiaEurope & Central Asia (excluding high income)Europe & Central Asia (IDA & IBRD countries)European UnionFaroe IslandsFijiFinlandFragile and conflict affected situationsFranceFrench PolynesiaGabonGambia, TheGeorgiaGermanyGhanaGreeceGrenadaGuatemalaGuineaGuinea-BissauGuyanaHaitiHeavily indebted poor countries (HIPC)High incomeHondurasHong Kong SAR, ChinaHungaryIBRD onlyIcelandIDA & IBRD totalIDA onlyIDA totalIndiaIndonesiaIran, Islamic Rep.IraqIrelandIsraelItalyJamaicaJapanJordanKazakhstanKenyaKiribatiKorea, Rep.KosovoKuwaitKyrgyz RepublicLao PDRLate-demographic dividendLatin America & Caribbean Latin America & Caribbean (excluding high income)Latin America & the Caribbean (IDA & IBRD countries)LatviaLeast developed countries: UN classificationLebanonLesothoLiberiaLibyaLithuaniaLow & middle incomeLow incomeLower middle incomeLuxembourgMacao SAR, ChinaMacedonia, FYRMadagascarMalawiMalaysiaMaldivesMaliMaltaMarshall IslandsMauritaniaMauritiusMexicoMicronesia, Fed. Sts.Middle East & North AfricaMiddle East & North Africa (excluding high income)Middle East & North Africa (IDA & IBRD countries)Middle incomeMoldovaMongoliaMontenegroMoroccoMozambiqueMyanmarNamibiaNepalNetherlandsNew CaledoniaNew ZealandNicaraguaNigerNigeriaNorth AmericaNorwayOECD membersOmanOther small statesPacific island small statesPakistanPalauPanamaPapua New GuineaParaguayPeruPhilippinesPolandPortugalPost-demographic dividendPre-demographic dividendQatarRomaniaRussian FederationRwandaSamoaSao Tome and PrincipeSaudi ArabiaSenegalSerbiaSeychellesSierra LeoneSingaporeSint Maarten (Dutch part)Slovak RepublicSloveniaSmall statesSolomon IslandsSouth AfricaSouth AsiaSouth Asia (IDA & IBRD)South SudanSpainSri LankaSt. Kitts and NevisSt. LuciaSt. Vincent and the GrenadinesSub-Saharan Africa Sub-Saharan Africa (excluding high income)Sub-Saharan Africa (IDA & IBRD countries)SudanSurinameSwazilandSwedenSwitzerlandSyrian Arab RepublicTajikistanTanzaniaThailandTimor-LesteTogoTongaTrinidad and TobagoTunisiaTurkeyTuvaluUgandaUkraineUnited KingdomUnited StatesUpper middle incomeUruguayVanuatuVenezuela, RBWest Bank and GazaWorldYemen, Rep.ZambiaZimbabwe Timeline:
This timeline shows a graph from 1976 to 2016 of Lesotho. No data until 1975. Number of actual observations by date: 41.
Source name:
World Development Indicators
Source organization:
International Monetary Fund, Balance of Payments Statistics Yearbook and data files.
Categories, topics:
Economy & Growth, Trade
Last updated:
apr 23, 2017
Indicators value changes by year
Maximum:
49.745
jan 1, 1981
At the date of observation
Value
Absolute change
Change from previous value
jan 1, 1976
32.624
+32.624
0.0%
jan 1, 1977
31.868
-0.756
-2.32%
jan 1, 1978
37.037
+5.169
16.22%
jan 1, 1979
39.231
+2.194
5.92%
jan 1, 1980
39.057
-0.174
-0.44%
jan 1, 1981
49.745
+10.688
27.36%
jan 1, 1982
46.281
-3.464
-6.96%
jan 1, 1983
40.836
-5.445
-11.76%
jan 1, 1984
39.571
-1.265
-3.1%
jan 1, 1985
39.306
-0.265
-0.67%
jan 1, 1986
40.313
+1.008
2.56%
jan 1, 1987
44.454
+4.14
10.27%
jan 1, 1988
44.373
-0.08
-0.18%
jan 1, 1989
38.888
-5.485
-12.36%
jan 1, 1990
40.805
+1.917
4.93%
jan 1, 1991
41.866
+1.061
2.6%
jan 1, 1992
39.395
-2.471
-5.9%
jan 1, 1993
32.898
-6.497
-16.49%
jan 1, 1994
33.201
+0.303
0.92%
jan 1, 1995
33.569
+0.369
1.11%
jan 1, 1996
6.55
-27.019
-80.49%
jan 1, 1997
2.748
-3.802
-58.05%
jan 1, 1998
15.796
+13.048
474.8%
jan 1, 1999
6.453
-9.343
-59.15%
jan 1, 2000
5.945
-0.508
-7.88%
jan 1, 2001
12.881
+6.936
116.67%
jan 1, 2002
16.705
+3.824
29.69%
jan 1, 2003
14.877
-1.828
-10.94%
jan 1, 2004
14.767
-0.11
-0.74%
jan 1, 2005
13.17
-1.597
-10.82%
jan 1, 2006
14.012
+0.842
6.39%
jan 1, 2007
17.868
+3.856
27.52%
jan 1, 2008
13.605
-4.263
-23.86%
jan 1, 2009
23.746
+10.141
74.53%
jan 1, 2010
30.902
+7.156
30.14%
jan 1, 2011
21.191
-9.71
-31.42%
jan 1, 2012
22.3
+1.109
5.23%
jan 1, 2013
25.746
+3.445
15.45%
jan 1, 2014
23.628
-2.118
-8.23%
jan 1, 2015
25.974
+2.346
9.93%
jan 1, 2016
24.252
-1.722
-6.63%
Ranking of countries by current statistics by years


Comments: