29
/
en
AIzaSyAYiBZKx7MnpbEhh9jyipgxe19OcubqV5w
April 1, 2024
130222
Ethiopia
ETH
true
2
1
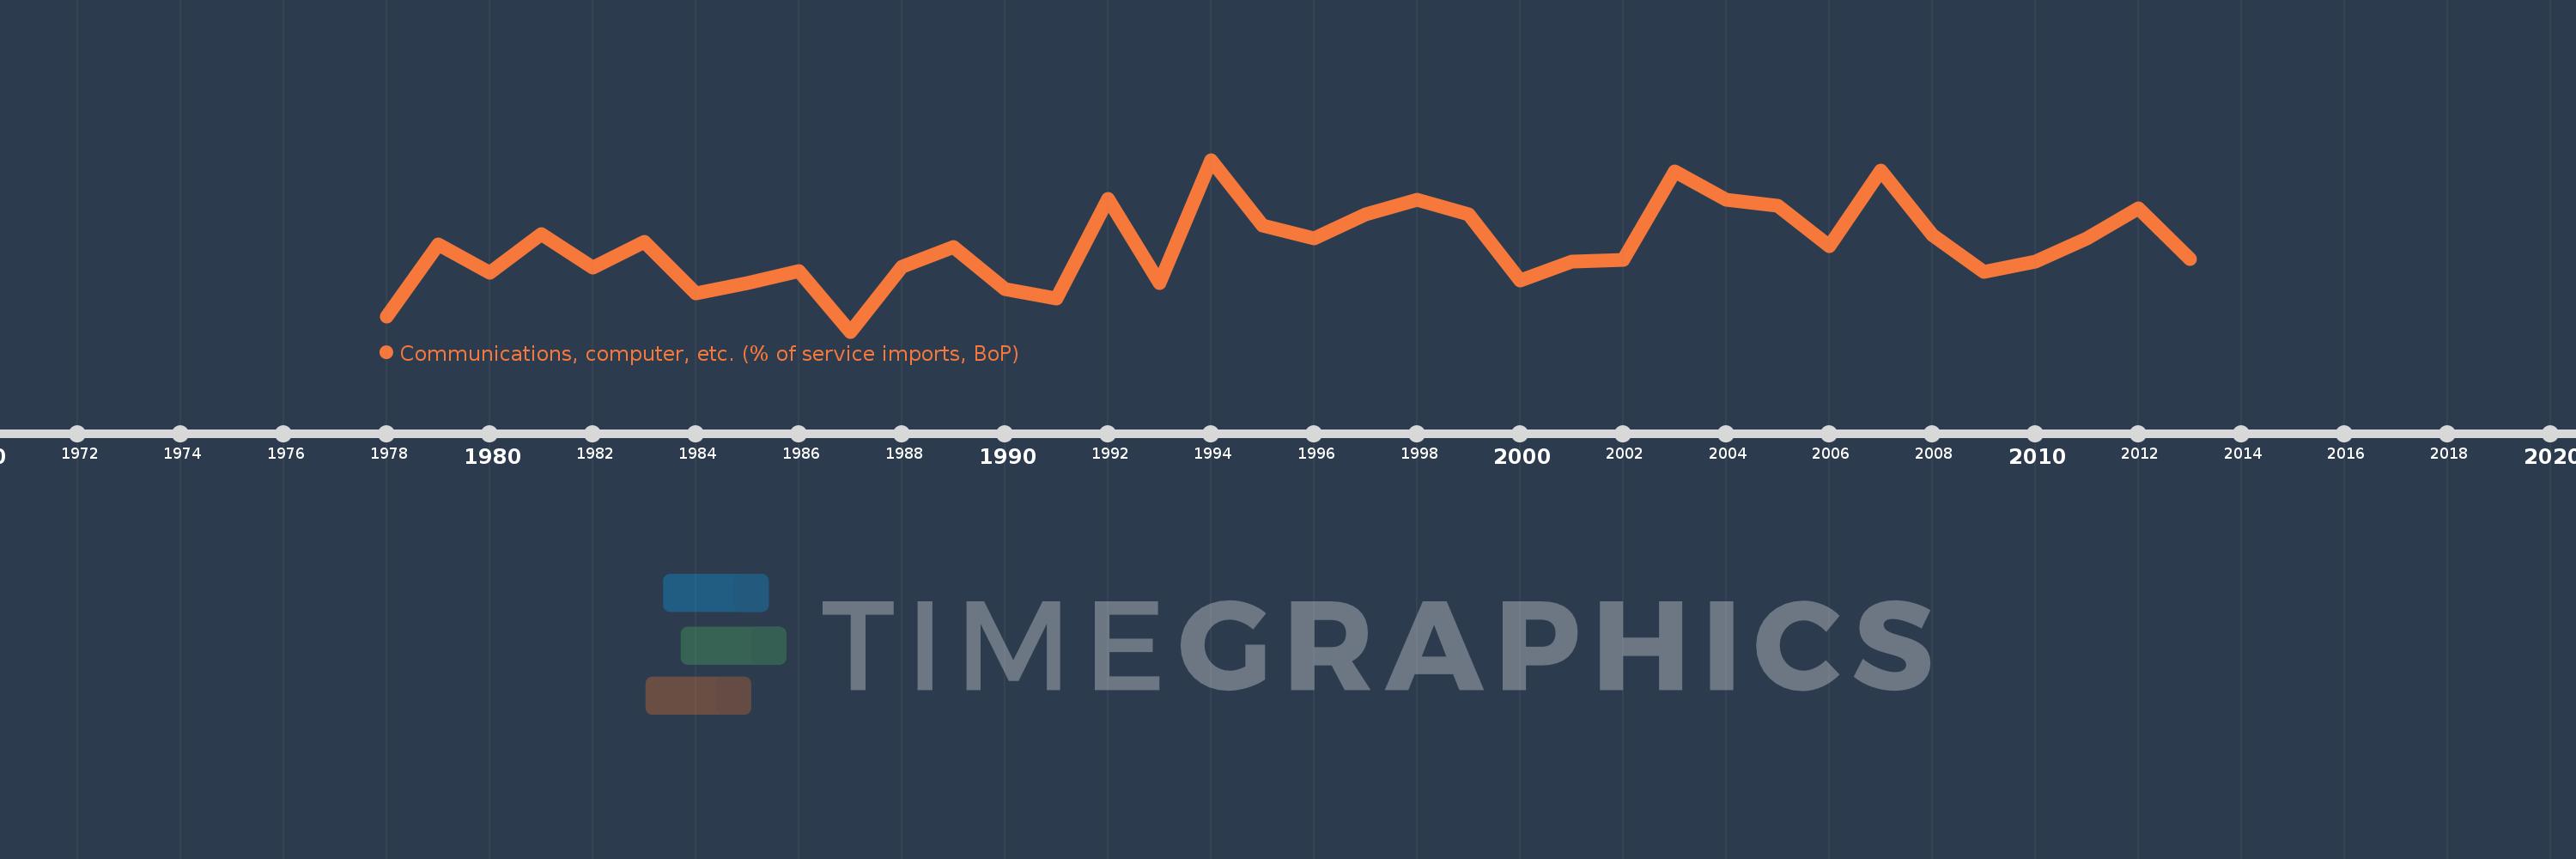
Communications, computer, etc. (% of service imports, BoP)
2013,2012,2011,2010,2009,2008,2007,2006,2005,2004,2003,2002,2001,2000,1999,1998,1997,1996,1995,1994,1993,1992,1991,1990,1989,1988,1987,1986,1985,1984,1983,1982,1981,1980,1979,1978
This statistics in other country:
AfghanistanAlbaniaAlgeriaAngolaAntigua and BarbudaArab WorldArgentinaArmeniaArubaAustraliaAustriaAzerbaijanBahamas, TheBahrainBangladeshBarbadosBelarusBelgiumBelizeBeninBermudaBhutanBoliviaBosnia and HerzegovinaBotswanaBrazilBrunei DarussalamBulgariaBurkina FasoBurundiCabo VerdeCambodiaCameroonCanadaCaribbean small statesCentral African RepublicCentral Europe and the BalticsChadChileChinaColombiaComorosCongo, Dem. Rep.Congo, Rep.Costa RicaCote d'IvoireCroatiaCuracaoCyprusCzech RepublicDenmarkDjiboutiDominicaDominican RepublicEarly-demographic dividendEast Asia & PacificEast Asia & Pacific (excluding high income)East Asia & Pacific (IDA & IBRD countries)EcuadorEgypt, Arab Rep.El SalvadorEquatorial GuineaEritreaEstoniaEthiopiaEuro areaEurope & Central AsiaEurope & Central Asia (excluding high income)Europe & Central Asia (IDA & IBRD countries)European UnionFaroe IslandsFijiFinlandFragile and conflict affected situationsFranceFrench PolynesiaGabonGambia, TheGeorgiaGermanyGhanaGreeceGrenadaGuatemalaGuineaGuinea-BissauGuyanaHaitiHeavily indebted poor countries (HIPC)High incomeHondurasHong Kong SAR, ChinaHungaryIBRD onlyIcelandIDA & IBRD totalIDA onlyIDA totalIndiaIndonesiaIran, Islamic Rep.IraqIrelandIsraelItalyJamaicaJapanJordanKazakhstanKenyaKiribatiKorea, Rep.KosovoKuwaitKyrgyz RepublicLao PDRLate-demographic dividendLatin America & Caribbean Latin America & Caribbean (excluding high income)Latin America & the Caribbean (IDA & IBRD countries)LatviaLeast developed countries: UN classificationLebanonLesothoLiberiaLibyaLithuaniaLow & middle incomeLow incomeLower middle incomeLuxembourgMacao SAR, ChinaMacedonia, FYRMadagascarMalawiMalaysiaMaldivesMaliMaltaMarshall IslandsMauritaniaMauritiusMexicoMicronesia, Fed. Sts.Middle East & North AfricaMiddle East & North Africa (excluding high income)Middle East & North Africa (IDA & IBRD countries)Middle incomeMoldovaMongoliaMontenegroMoroccoMozambiqueMyanmarNamibiaNepalNetherlandsNew CaledoniaNew ZealandNicaraguaNigerNigeriaNorth AmericaNorwayOECD membersOmanOther small statesPacific island small statesPakistanPalauPanamaPapua New GuineaParaguayPeruPhilippinesPolandPortugalPost-demographic dividendPre-demographic dividendQatarRomaniaRussian FederationRwandaSamoaSao Tome and PrincipeSaudi ArabiaSenegalSerbiaSeychellesSierra LeoneSingaporeSint Maarten (Dutch part)Slovak RepublicSloveniaSmall statesSolomon IslandsSouth AfricaSouth AsiaSouth Asia (IDA & IBRD)South SudanSpainSri LankaSt. Kitts and NevisSt. LuciaSt. Vincent and the GrenadinesSub-Saharan Africa Sub-Saharan Africa (excluding high income)Sub-Saharan Africa (IDA & IBRD countries)SudanSurinameSwazilandSwedenSwitzerlandSyrian Arab RepublicTajikistanTanzaniaThailandTimor-LesteTogoTongaTrinidad and TobagoTunisiaTurkeyTuvaluUgandaUkraineUnited KingdomUnited StatesUpper middle incomeUruguayVanuatuVenezuela, RBWest Bank and GazaWorldYemen, Rep.ZambiaZimbabwe Timeline:
This timeline shows a graph from 1978 to 2013 of Ethiopia. No data until 1977. Number of actual observations by date: 36.
Source name:
World Development Indicators
Source organization:
International Monetary Fund, Balance of Payments Statistics Yearbook and data files.
Categories, topics:
Economy & Growth, Trade
Last updated:
apr 23, 2017
Indicators value changes by year
Minimum:
16.196
jan 1, 1987
Maximum:
32.847
jan 1, 1994
At the date of observation
Value
Absolute change
Change from previous value
jan 1, 1978
17.665
+17.665
0.0%
jan 1, 1979
24.616
+6.951
39.35%
jan 1, 1980
21.913
-2.703
-10.98%
jan 1, 1981
25.609
+3.696
16.87%
jan 1, 1982
22.381
-3.228
-12.61%
jan 1, 1983
24.909
+2.528
11.3%
jan 1, 1984
19.94
-4.969
-19.95%
jan 1, 1985
20.884
+0.944
4.73%
jan 1, 1986
22.034
+1.15
5.51%
jan 1, 1987
16.196
-5.838
-26.5%
jan 1, 1988
22.453
+6.257
38.63%
jan 1, 1989
24.426
+1.973
8.79%
jan 1, 1990
20.317
-4.109
-16.82%
jan 1, 1991
19.4
-0.917
-4.51%
jan 1, 1992
29.035
+9.635
49.67%
jan 1, 1993
20.888
-8.147
-28.06%
jan 1, 1994
32.847
+11.959
57.26%
jan 1, 1995
26.45
-6.397
-19.47%
jan 1, 1996
25.188
-1.263
-4.77%
jan 1, 1997
27.568
+2.38
9.45%
jan 1, 1998
29.017
+1.449
5.26%
jan 1, 1999
27.563
-1.453
-5.01%
jan 1, 2000
21.121
-6.442
-23.37%
jan 1, 2001
23.021
+1.9
9.0%
jan 1, 2002
23.164
+0.143
0.62%
jan 1, 2003
31.756
+8.592
37.09%
jan 1, 2004
28.951
-2.805
-8.83%
jan 1, 2005
28.422
-0.529
-1.83%
jan 1, 2006
24.477
-3.946
-13.88%
jan 1, 2007
31.846
+7.369
30.11%
jan 1, 2008
25.571
-6.274
-19.7%
jan 1, 2009
21.952
-3.62
-14.15%
jan 1, 2010
22.944
+0.992
4.52%
jan 1, 2011
25.247
+2.303
10.04%
jan 1, 2012
28.173
+2.925
11.59%
jan 1, 2013
23.254
-4.918
-17.46%
Ranking of countries by current statistics by years


Comments: