29
/
en
AIzaSyAYiBZKx7MnpbEhh9jyipgxe19OcubqV5w
April 1, 2024
33302
European Union
EUU
false
2
1
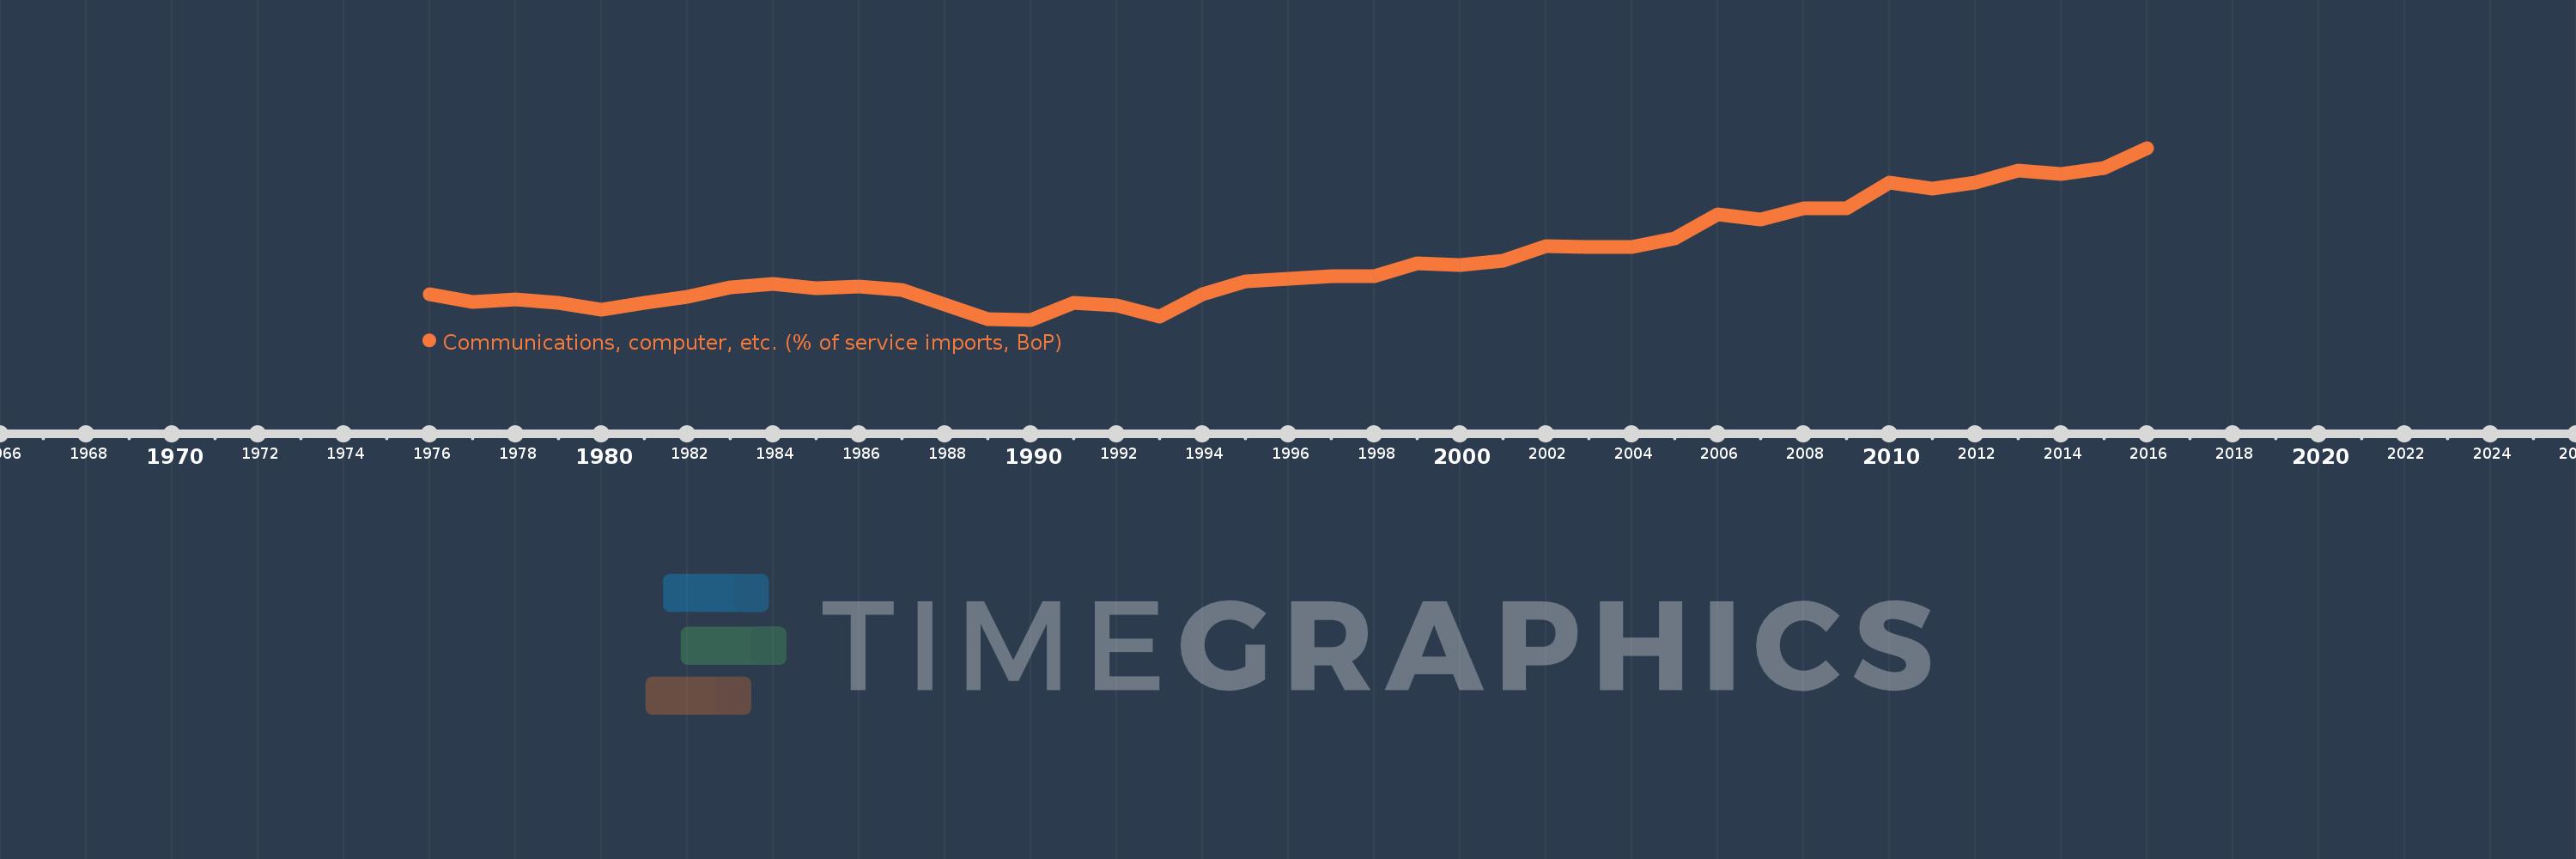
Communications, computer, etc. (% of service imports, BoP)
2016,2015,2014,2013,2012,2011,2010,2009,2008,2007,2006,2005,2004,2003,2002,2001,2000,1999,1998,1997,1996,1995,1994,1993,1992,1991,1990,1989,1988,1987,1986,1985,1984,1983,1982,1981,1980,1979,1978,1977,1976
This statistics in other country:
AfghanistanAlbaniaAlgeriaAngolaAntigua and BarbudaArab WorldArgentinaArmeniaArubaAustraliaAustriaAzerbaijanBahamas, TheBahrainBangladeshBarbadosBelarusBelgiumBelizeBeninBermudaBhutanBoliviaBosnia and HerzegovinaBotswanaBrazilBrunei DarussalamBulgariaBurkina FasoBurundiCabo VerdeCambodiaCameroonCanadaCaribbean small statesCentral African RepublicCentral Europe and the BalticsChadChileChinaColombiaComorosCongo, Dem. Rep.Congo, Rep.Costa RicaCote d'IvoireCroatiaCuracaoCyprusCzech RepublicDenmarkDjiboutiDominicaDominican RepublicEarly-demographic dividendEast Asia & PacificEast Asia & Pacific (excluding high income)East Asia & Pacific (IDA & IBRD countries)EcuadorEgypt, Arab Rep.El SalvadorEquatorial GuineaEritreaEstoniaEthiopiaEuro areaEurope & Central AsiaEurope & Central Asia (excluding high income)Europe & Central Asia (IDA & IBRD countries)European UnionFaroe IslandsFijiFinlandFragile and conflict affected situationsFranceFrench PolynesiaGabonGambia, TheGeorgiaGermanyGhanaGreeceGrenadaGuatemalaGuineaGuinea-BissauGuyanaHaitiHeavily indebted poor countries (HIPC)High incomeHondurasHong Kong SAR, ChinaHungaryIBRD onlyIcelandIDA & IBRD totalIDA onlyIDA totalIndiaIndonesiaIran, Islamic Rep.IraqIrelandIsraelItalyJamaicaJapanJordanKazakhstanKenyaKiribatiKorea, Rep.KosovoKuwaitKyrgyz RepublicLao PDRLate-demographic dividendLatin America & Caribbean Latin America & Caribbean (excluding high income)Latin America & the Caribbean (IDA & IBRD countries)LatviaLeast developed countries: UN classificationLebanonLesothoLiberiaLibyaLithuaniaLow & middle incomeLow incomeLower middle incomeLuxembourgMacao SAR, ChinaMacedonia, FYRMadagascarMalawiMalaysiaMaldivesMaliMaltaMarshall IslandsMauritaniaMauritiusMexicoMicronesia, Fed. Sts.Middle East & North AfricaMiddle East & North Africa (excluding high income)Middle East & North Africa (IDA & IBRD countries)Middle incomeMoldovaMongoliaMontenegroMoroccoMozambiqueMyanmarNamibiaNepalNetherlandsNew CaledoniaNew ZealandNicaraguaNigerNigeriaNorth AmericaNorwayOECD membersOmanOther small statesPacific island small statesPakistanPalauPanamaPapua New GuineaParaguayPeruPhilippinesPolandPortugalPost-demographic dividendPre-demographic dividendQatarRomaniaRussian FederationRwandaSamoaSao Tome and PrincipeSaudi ArabiaSenegalSerbiaSeychellesSierra LeoneSingaporeSint Maarten (Dutch part)Slovak RepublicSloveniaSmall statesSolomon IslandsSouth AfricaSouth AsiaSouth Asia (IDA & IBRD)South SudanSpainSri LankaSt. Kitts and NevisSt. LuciaSt. Vincent and the GrenadinesSub-Saharan Africa Sub-Saharan Africa (excluding high income)Sub-Saharan Africa (IDA & IBRD countries)SudanSurinameSwazilandSwedenSwitzerlandSyrian Arab RepublicTajikistanTanzaniaThailandTimor-LesteTogoTongaTrinidad and TobagoTunisiaTurkeyTuvaluUgandaUkraineUnited KingdomUnited StatesUpper middle incomeUruguayVanuatuVenezuela, RBWest Bank and GazaWorldYemen, Rep.ZambiaZimbabwe Timeline:
This timeline shows a graph from 1976 to 2016 of European Union. No data until 1975. Number of actual observations by date: 41.
Source name:
World Development Indicators
Source organization:
International Monetary Fund, Balance of Payments Statistics Yearbook and data files.
Categories, topics:
Economy & Growth, Trade
Last updated:
apr 23, 2017
Indicators value changes by year
Minimum:
31.904
jan 1, 1990
Maximum:
52.949
jan 1, 2016
At the date of observation
Value
Absolute change
Change from previous value
jan 1, 1976
35.065
+35.065
0.0%
jan 1, 1977
34.046
-1.019
-2.91%
jan 1, 1978
34.352
+0.306
0.9%
jan 1, 1979
34.02
-0.332
-0.97%
jan 1, 1980
33.137
-0.883
-2.6%
jan 1, 1981
33.984
+0.846
2.55%
jan 1, 1982
34.709
+0.725
2.13%
jan 1, 1983
35.907
+1.198
3.45%
jan 1, 1984
36.293
+0.386
1.07%
jan 1, 1985
35.74
-0.553
-1.52%
jan 1, 1986
35.99
+0.25
0.7%
jan 1, 1987
35.528
-0.462
-1.28%
jan 1, 1988
33.805
-1.723
-4.85%
jan 1, 1989
31.972
-1.833
-5.42%
jan 1, 1990
31.904
-0.068
-0.21%
jan 1, 1991
34.006
+2.102
6.59%
jan 1, 1992
33.668
-0.338
-0.99%
jan 1, 1993
32.314
-1.354
-4.02%
jan 1, 1994
35.026
+2.712
8.39%
jan 1, 1995
36.586
+1.559
4.45%
jan 1, 1996
36.95
+0.365
1.0%
jan 1, 1997
37.205
+0.255
0.69%
jan 1, 1998
37.244
+0.039
0.11%
jan 1, 1999
38.77
+1.526
4.1%
jan 1, 2000
38.614
-0.156
-0.4%
jan 1, 2001
39.15
+0.536
1.39%
jan 1, 2002
40.88
+1.73
4.42%
jan 1, 2003
40.797
-0.083
-0.2%
jan 1, 2004
40.815
+0.018
0.04%
jan 1, 2005
41.844
+1.029
2.52%
jan 1, 2006
44.802
+2.958
7.07%
jan 1, 2007
44.231
-0.571
-1.28%
jan 1, 2008
45.521
+1.29
2.92%
jan 1, 2009
45.603
+0.083
0.18%
jan 1, 2010
48.751
+3.148
6.9%
jan 1, 2011
47.959
-0.792
-1.63%
jan 1, 2012
48.7
+0.741
1.54%
jan 1, 2013
50.163
+1.464
3.01%
jan 1, 2014
49.812
-0.352
-0.7%
jan 1, 2015
50.487
+0.676
1.36%
jan 1, 2016
52.949
+2.462
4.88%
Ranking of countries by current statistics by years


Comments: