29
/
en
AIzaSyAYiBZKx7MnpbEhh9jyipgxe19OcubqV5w
April 1, 2024
35610
High income
HIC
false
2
1
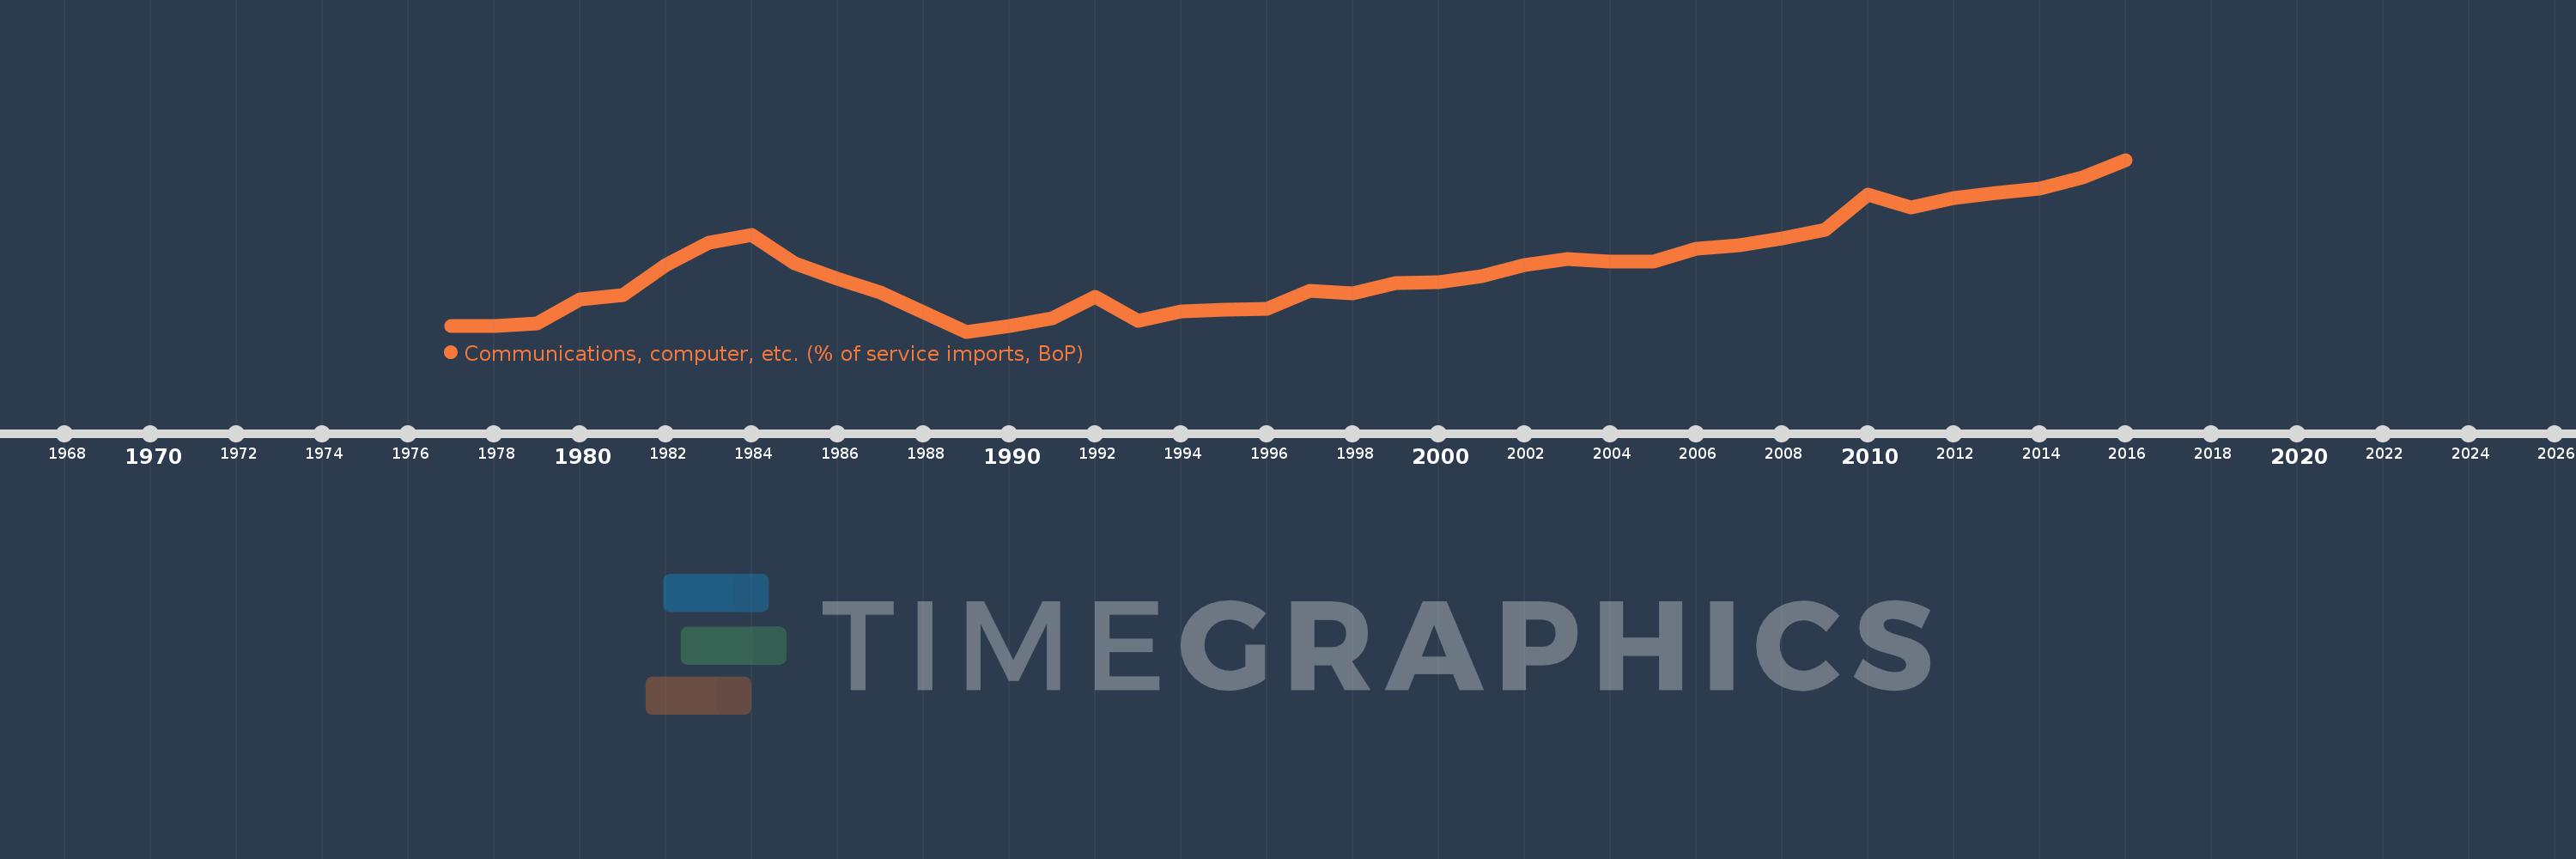
Communications, computer, etc. (% of service imports, BoP)
2016,2015,2014,2013,2012,2011,2010,2009,2008,2007,2006,2005,2004,2003,2002,2001,2000,1999,1998,1997,1996,1995,1994,1993,1992,1991,1990,1989,1988,1987,1986,1985,1984,1983,1982,1981,1980,1979,1978,1977
This statistics in other country:
AfghanistanAlbaniaAlgeriaAngolaAntigua and BarbudaArab WorldArgentinaArmeniaArubaAustraliaAustriaAzerbaijanBahamas, TheBahrainBangladeshBarbadosBelarusBelgiumBelizeBeninBermudaBhutanBoliviaBosnia and HerzegovinaBotswanaBrazilBrunei DarussalamBulgariaBurkina FasoBurundiCabo VerdeCambodiaCameroonCanadaCaribbean small statesCentral African RepublicCentral Europe and the BalticsChadChileChinaColombiaComorosCongo, Dem. Rep.Congo, Rep.Costa RicaCote d'IvoireCroatiaCuracaoCyprusCzech RepublicDenmarkDjiboutiDominicaDominican RepublicEarly-demographic dividendEast Asia & PacificEast Asia & Pacific (excluding high income)East Asia & Pacific (IDA & IBRD countries)EcuadorEgypt, Arab Rep.El SalvadorEquatorial GuineaEritreaEstoniaEthiopiaEuro areaEurope & Central AsiaEurope & Central Asia (excluding high income)Europe & Central Asia (IDA & IBRD countries)European UnionFaroe IslandsFijiFinlandFragile and conflict affected situationsFranceFrench PolynesiaGabonGambia, TheGeorgiaGermanyGhanaGreeceGrenadaGuatemalaGuineaGuinea-BissauGuyanaHaitiHeavily indebted poor countries (HIPC)High incomeHondurasHong Kong SAR, ChinaHungaryIBRD onlyIcelandIDA & IBRD totalIDA onlyIDA totalIndiaIndonesiaIran, Islamic Rep.IraqIrelandIsraelItalyJamaicaJapanJordanKazakhstanKenyaKiribatiKorea, Rep.KosovoKuwaitKyrgyz RepublicLao PDRLate-demographic dividendLatin America & Caribbean Latin America & Caribbean (excluding high income)Latin America & the Caribbean (IDA & IBRD countries)LatviaLeast developed countries: UN classificationLebanonLesothoLiberiaLibyaLithuaniaLow & middle incomeLow incomeLower middle incomeLuxembourgMacao SAR, ChinaMacedonia, FYRMadagascarMalawiMalaysiaMaldivesMaliMaltaMarshall IslandsMauritaniaMauritiusMexicoMicronesia, Fed. Sts.Middle East & North AfricaMiddle East & North Africa (excluding high income)Middle East & North Africa (IDA & IBRD countries)Middle incomeMoldovaMongoliaMontenegroMoroccoMozambiqueMyanmarNamibiaNepalNetherlandsNew CaledoniaNew ZealandNicaraguaNigerNigeriaNorth AmericaNorwayOECD membersOmanOther small statesPacific island small statesPakistanPalauPanamaPapua New GuineaParaguayPeruPhilippinesPolandPortugalPost-demographic dividendPre-demographic dividendQatarRomaniaRussian FederationRwandaSamoaSao Tome and PrincipeSaudi ArabiaSenegalSerbiaSeychellesSierra LeoneSingaporeSint Maarten (Dutch part)Slovak RepublicSloveniaSmall statesSolomon IslandsSouth AfricaSouth AsiaSouth Asia (IDA & IBRD)South SudanSpainSri LankaSt. Kitts and NevisSt. LuciaSt. Vincent and the GrenadinesSub-Saharan Africa Sub-Saharan Africa (excluding high income)Sub-Saharan Africa (IDA & IBRD countries)SudanSurinameSwazilandSwedenSwitzerlandSyrian Arab RepublicTajikistanTanzaniaThailandTimor-LesteTogoTongaTrinidad and TobagoTunisiaTurkeyTuvaluUgandaUkraineUnited KingdomUnited StatesUpper middle incomeUruguayVanuatuVenezuela, RBWest Bank and GazaWorldYemen, Rep.ZambiaZimbabwe Timeline:
This timeline shows a graph from 1977 to 2016 of High income. No data until 1976. Number of actual observations by date: 40.
Source name:
World Development Indicators
Source organization:
International Monetary Fund, Balance of Payments Statistics Yearbook and data files.
Categories, topics:
Economy & Growth, Trade
Last updated:
apr 23, 2017
Indicators value changes by year
Minimum:
34.762
jan 1, 1989
Maximum:
50.147
jan 1, 2016
At the date of observation
Value
Absolute change
Change from previous value
jan 1, 1977
35.234
+35.234
0.0%
jan 1, 1978
35.261
+0.027
0.08%
jan 1, 1979
35.517
+0.256
0.72%
jan 1, 1980
37.609
+2.092
5.89%
jan 1, 1981
38.011
+0.403
1.07%
jan 1, 1982
40.75
+2.738
7.2%
jan 1, 1983
42.712
+1.963
4.82%
jan 1, 1984
43.411
+0.699
1.64%
jan 1, 1985
40.851
-2.56
-5.9%
jan 1, 1986
39.5
-1.35
-3.31%
jan 1, 1987
38.265
-1.236
-3.13%
jan 1, 1988
36.473
-1.792
-4.68%
jan 1, 1989
34.762
-1.711
-4.69%
jan 1, 1990
35.253
+0.491
1.41%
jan 1, 1991
35.944
+0.691
1.96%
jan 1, 1992
37.886
+1.941
5.4%
jan 1, 1993
35.729
-2.156
-5.69%
jan 1, 1994
36.555
+0.826
2.31%
jan 1, 1995
36.717
+0.162
0.44%
jan 1, 1996
36.816
+0.1
0.27%
jan 1, 1997
38.433
+1.616
4.39%
jan 1, 1998
38.221
-0.212
-0.55%
jan 1, 1999
39.131
+0.91
2.38%
jan 1, 2000
39.175
+0.044
0.11%
jan 1, 2001
39.762
+0.587
1.5%
jan 1, 2002
40.751
+0.989
2.49%
jan 1, 2003
41.291
+0.54
1.33%
jan 1, 2004
41.047
-0.244
-0.59%
jan 1, 2005
41.052
+0.005
0.01%
jan 1, 2006
42.174
+1.122
2.73%
jan 1, 2007
42.465
+0.291
0.69%
jan 1, 2008
43.129
+0.664
1.56%
jan 1, 2009
43.854
+0.726
1.68%
jan 1, 2010
47.002
+3.148
7.18%
jan 1, 2011
45.908
-1.094
-2.33%
jan 1, 2012
46.7
+0.792
1.72%
jan 1, 2013
47.163
+0.463
0.99%
jan 1, 2014
47.583
+0.421
0.89%
jan 1, 2015
48.544
+0.961
2.02%
jan 1, 2016
50.147
+1.603
3.3%
Ranking of countries by current statistics by years


Comments: