29
/
en
AIzaSyAYiBZKx7MnpbEhh9jyipgxe19OcubqV5w
April 1, 2024
184957
Madagascar
MDG
true
2
1
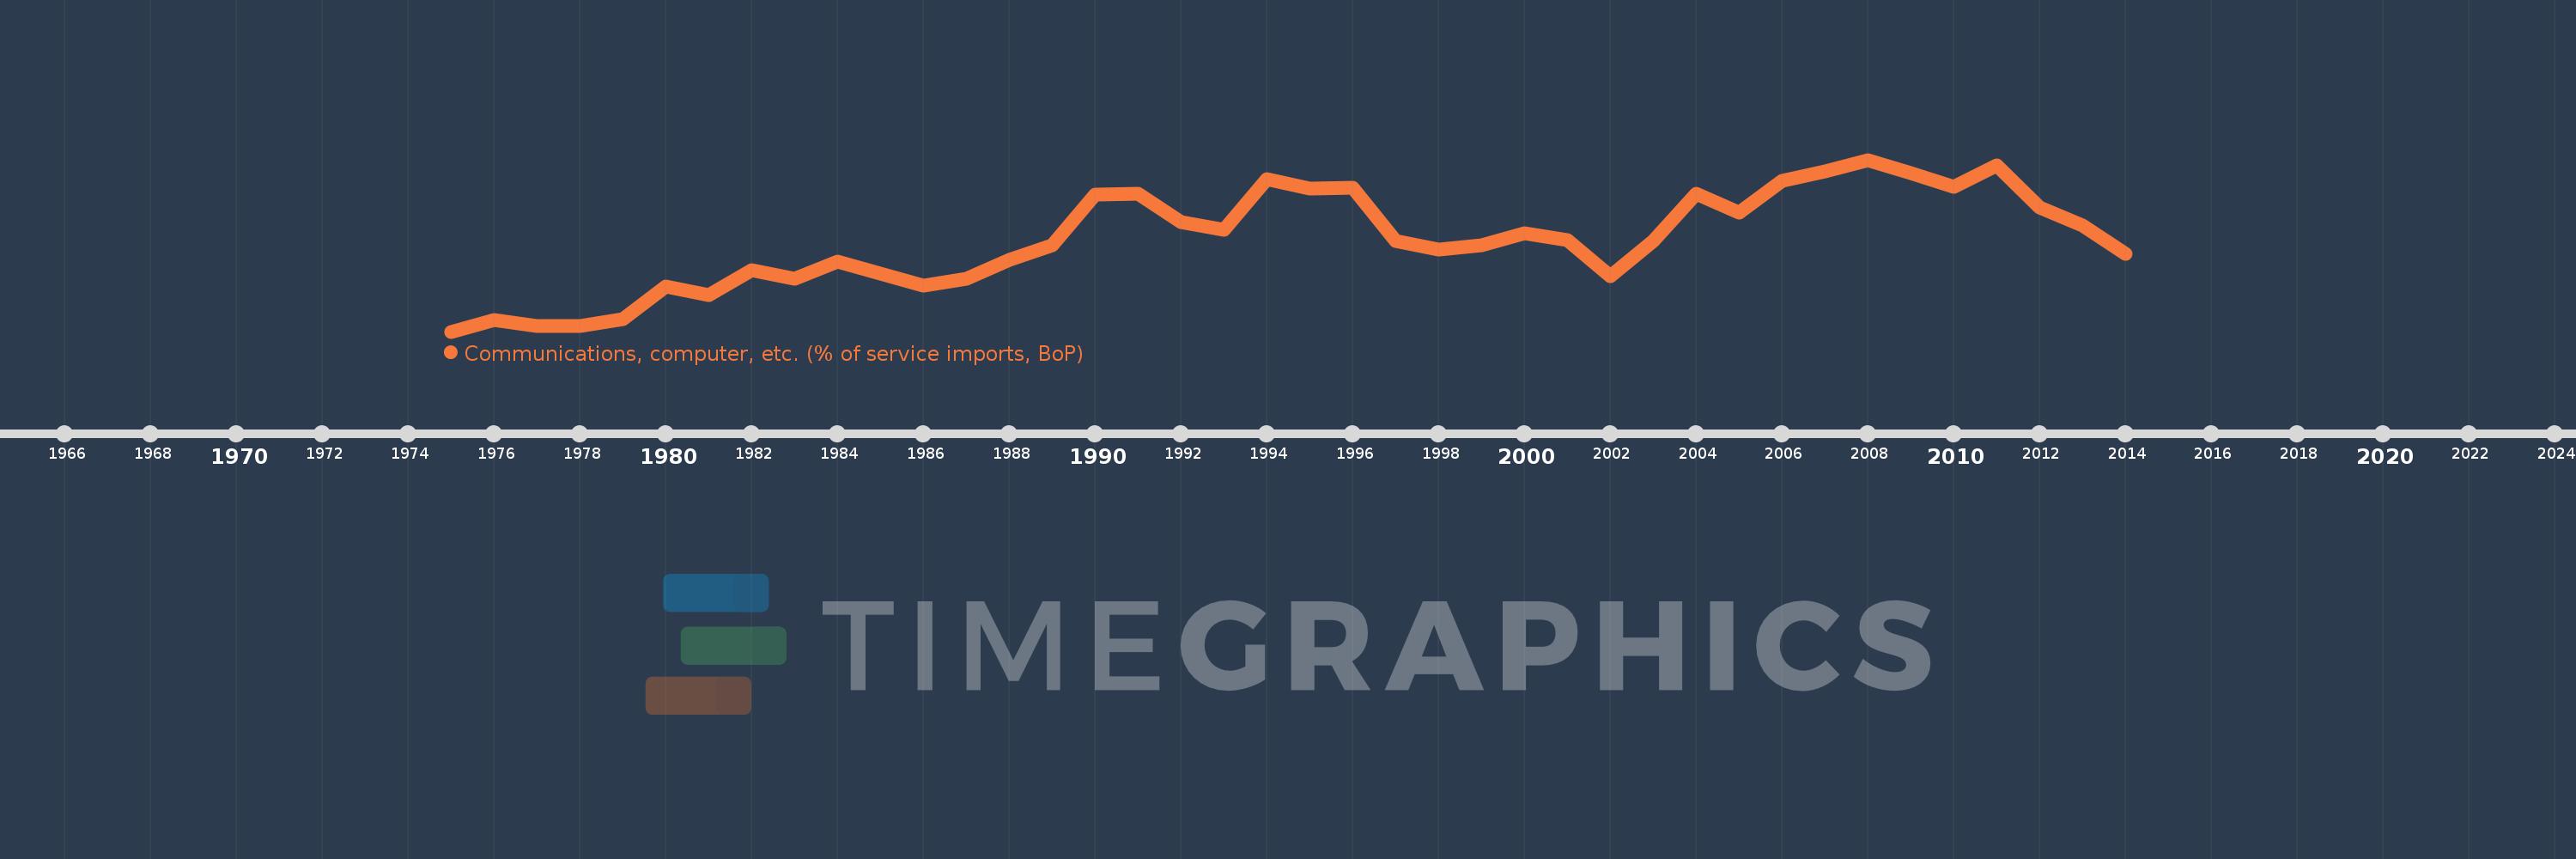
Communications, computer, etc. (% of service imports, BoP)
2014,2013,2012,2011,2010,2009,2008,2007,2006,2005,2004,2003,2002,2001,2000,1999,1998,1997,1996,1995,1994,1993,1992,1991,1990,1989,1988,1987,1986,1985,1984,1983,1982,1981,1980,1979,1978,1977,1976,1975
This statistics in other country:
AfghanistanAlbaniaAlgeriaAngolaAntigua and BarbudaArab WorldArgentinaArmeniaArubaAustraliaAustriaAzerbaijanBahamas, TheBahrainBangladeshBarbadosBelarusBelgiumBelizeBeninBermudaBhutanBoliviaBosnia and HerzegovinaBotswanaBrazilBrunei DarussalamBulgariaBurkina FasoBurundiCabo VerdeCambodiaCameroonCanadaCaribbean small statesCentral African RepublicCentral Europe and the BalticsChadChileChinaColombiaComorosCongo, Dem. Rep.Congo, Rep.Costa RicaCote d'IvoireCroatiaCuracaoCyprusCzech RepublicDenmarkDjiboutiDominicaDominican RepublicEarly-demographic dividendEast Asia & PacificEast Asia & Pacific (excluding high income)East Asia & Pacific (IDA & IBRD countries)EcuadorEgypt, Arab Rep.El SalvadorEquatorial GuineaEritreaEstoniaEthiopiaEuro areaEurope & Central AsiaEurope & Central Asia (excluding high income)Europe & Central Asia (IDA & IBRD countries)European UnionFaroe IslandsFijiFinlandFragile and conflict affected situationsFranceFrench PolynesiaGabonGambia, TheGeorgiaGermanyGhanaGreeceGrenadaGuatemalaGuineaGuinea-BissauGuyanaHaitiHeavily indebted poor countries (HIPC)High incomeHondurasHong Kong SAR, ChinaHungaryIBRD onlyIcelandIDA & IBRD totalIDA onlyIDA totalIndiaIndonesiaIran, Islamic Rep.IraqIrelandIsraelItalyJamaicaJapanJordanKazakhstanKenyaKiribatiKorea, Rep.KosovoKuwaitKyrgyz RepublicLao PDRLate-demographic dividendLatin America & Caribbean Latin America & Caribbean (excluding high income)Latin America & the Caribbean (IDA & IBRD countries)LatviaLeast developed countries: UN classificationLebanonLesothoLiberiaLibyaLithuaniaLow & middle incomeLow incomeLower middle incomeLuxembourgMacao SAR, ChinaMacedonia, FYRMadagascarMalawiMalaysiaMaldivesMaliMaltaMarshall IslandsMauritaniaMauritiusMexicoMicronesia, Fed. Sts.Middle East & North AfricaMiddle East & North Africa (excluding high income)Middle East & North Africa (IDA & IBRD countries)Middle incomeMoldovaMongoliaMontenegroMoroccoMozambiqueMyanmarNamibiaNepalNetherlandsNew CaledoniaNew ZealandNicaraguaNigerNigeriaNorth AmericaNorwayOECD membersOmanOther small statesPacific island small statesPakistanPalauPanamaPapua New GuineaParaguayPeruPhilippinesPolandPortugalPost-demographic dividendPre-demographic dividendQatarRomaniaRussian FederationRwandaSamoaSao Tome and PrincipeSaudi ArabiaSenegalSerbiaSeychellesSierra LeoneSingaporeSint Maarten (Dutch part)Slovak RepublicSloveniaSmall statesSolomon IslandsSouth AfricaSouth AsiaSouth Asia (IDA & IBRD)South SudanSpainSri LankaSt. Kitts and NevisSt. LuciaSt. Vincent and the GrenadinesSub-Saharan Africa Sub-Saharan Africa (excluding high income)Sub-Saharan Africa (IDA & IBRD countries)SudanSurinameSwazilandSwedenSwitzerlandSyrian Arab RepublicTajikistanTanzaniaThailandTimor-LesteTogoTongaTrinidad and TobagoTunisiaTurkeyTuvaluUgandaUkraineUnited KingdomUnited StatesUpper middle incomeUruguayVanuatuVenezuela, RBWest Bank and GazaWorldYemen, Rep.ZambiaZimbabwe Timeline:
This timeline shows a graph from 1975 to 2014 of Madagascar. No data until 1974. Number of actual observations by date: 40.
Source name:
World Development Indicators
Source organization:
International Monetary Fund, Balance of Payments Statistics Yearbook and data files.
Categories, topics:
Economy & Growth, Trade
Last updated:
apr 23, 2017
Indicators value changes by year
Minimum:
20.232
jan 1, 1975
Maximum:
57.384
jan 1, 2008
At the date of observation
Value
Absolute change
Change from previous value
jan 1, 1975
20.232
+20.232
0.0%
jan 1, 1976
22.691
+2.459
12.16%
jan 1, 1977
21.36
-1.331
-5.87%
jan 1, 1978
21.522
+0.162
0.76%
jan 1, 1979
22.861
+1.339
6.22%
jan 1, 1980
30.035
+7.174
31.38%
jan 1, 1981
28.036
-1.999
-6.66%
jan 1, 1982
33.525
+5.489
19.58%
jan 1, 1983
31.728
-1.797
-5.36%
jan 1, 1984
35.325
+3.597
11.34%
jan 1, 1985
32.741
-2.584
-7.31%
jan 1, 1986
30.171
-2.571
-7.85%
jan 1, 1987
31.674
+1.503
4.98%
jan 1, 1988
35.809
+4.135
13.06%
jan 1, 1989
38.908
+3.099
8.66%
jan 1, 1990
49.889
+10.98
28.22%
jan 1, 1991
50.001
+0.113
0.23%
jan 1, 1992
43.893
-6.108
-12.22%
jan 1, 1993
42.204
-1.689
-3.85%
jan 1, 1994
53.217
+11.012
26.09%
jan 1, 1995
51.159
-2.058
-3.87%
jan 1, 1996
51.339
+0.18
0.35%
jan 1, 1997
39.8
-11.539
-22.48%
jan 1, 1998
38.018
-1.783
-4.48%
jan 1, 1999
38.832
+0.814
2.14%
jan 1, 2000
41.561
+2.729
7.03%
jan 1, 2001
40.101
-1.46
-3.51%
jan 1, 2002
32.122
-7.979
-19.9%
jan 1, 2003
39.811
+7.688
23.93%
jan 1, 2004
50.035
+10.224
25.68%
jan 1, 2005
46.047
-3.988
-7.97%
jan 1, 2006
52.843
+6.796
14.76%
jan 1, 2007
54.832
+1.989
3.76%
jan 1, 2008
57.384
+2.552
4.65%
jan 1, 2009
54.554
-2.83
-4.93%
jan 1, 2010
51.498
-3.056
-5.6%
jan 1, 2011
56.267
+4.769
9.26%
jan 1, 2012
47.024
-9.243
-16.43%
jan 1, 2013
43.094
-3.93
-8.36%
jan 1, 2014
37.092
-6.003
-13.93%
Ranking of countries by current statistics by years


Comments: