29
/
en
AIzaSyAYiBZKx7MnpbEhh9jyipgxe19OcubqV5w
April 1, 2024
254997
Swaziland
SWZ
true
2
1
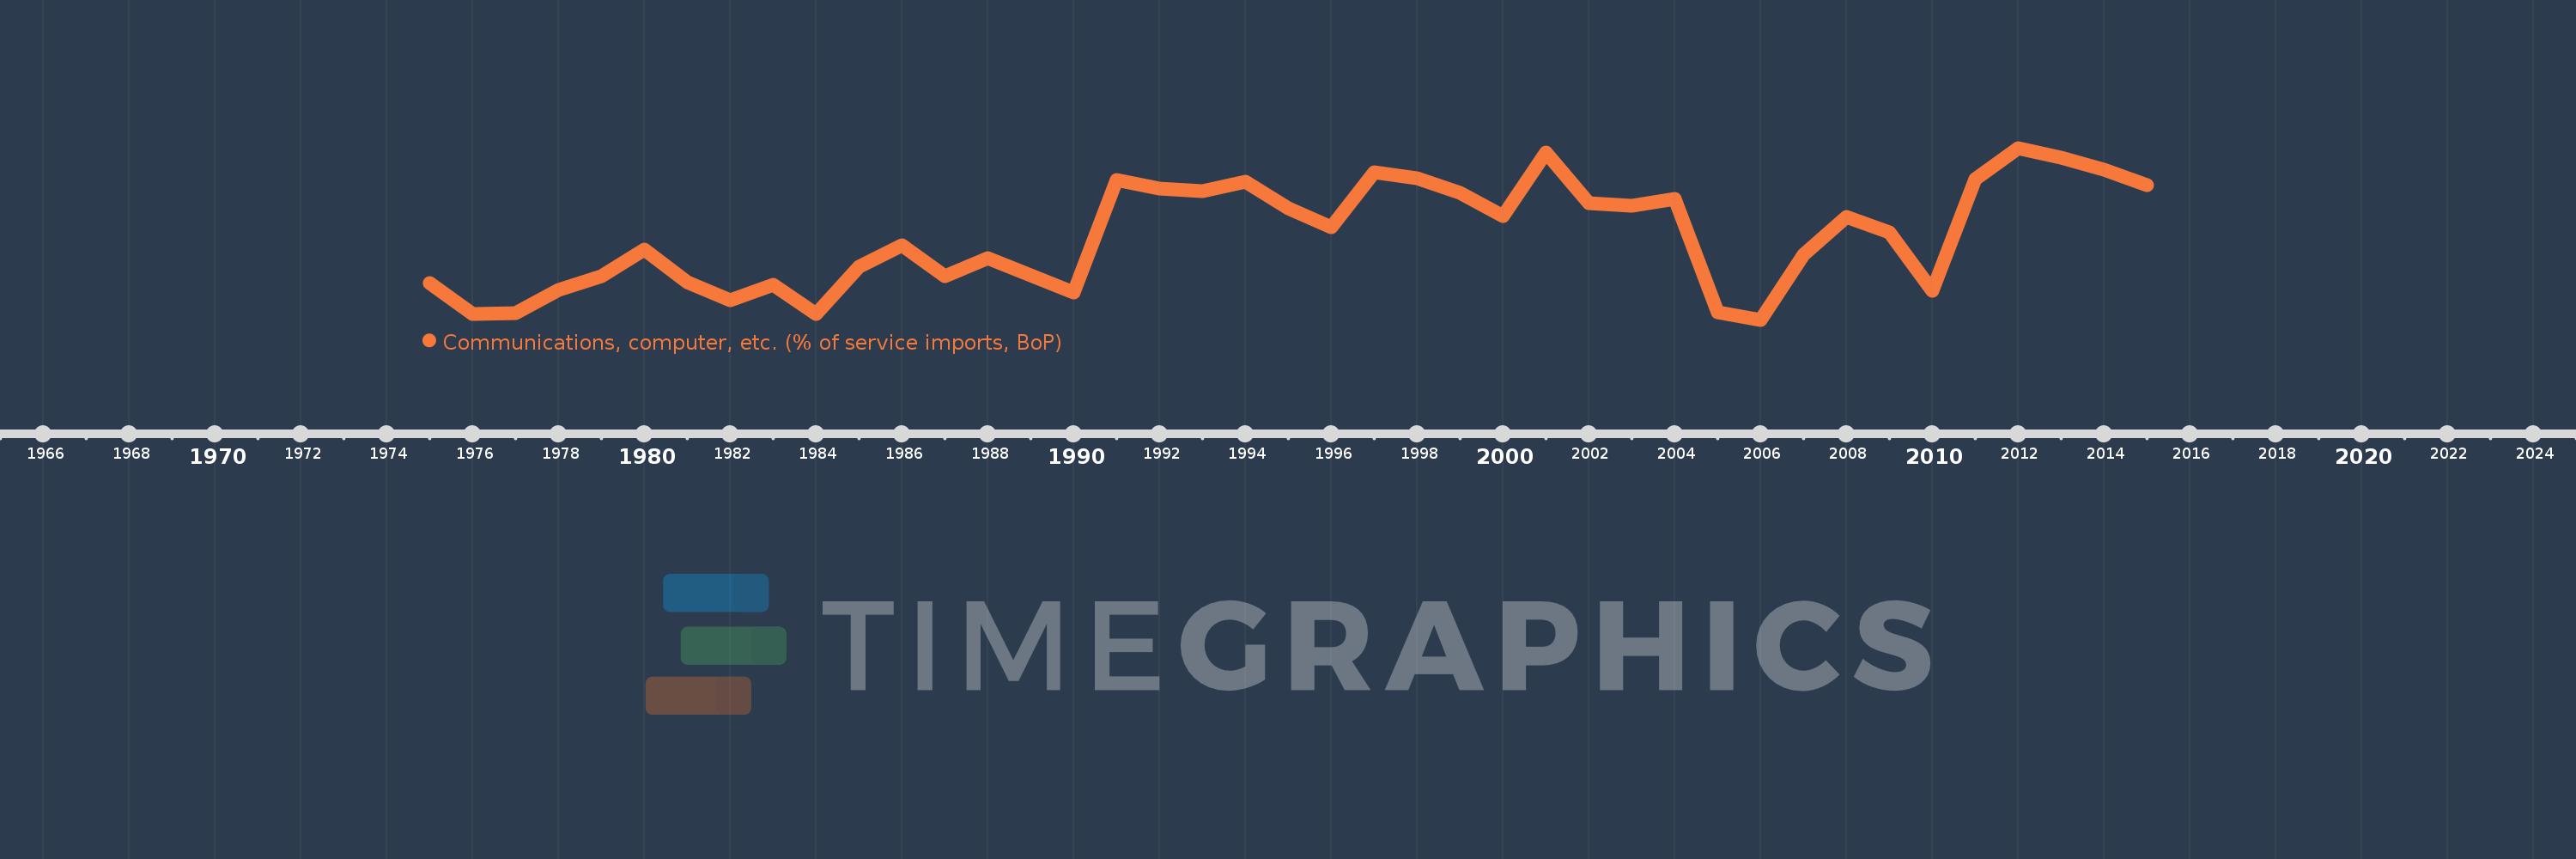
Communications, computer, etc. (% of service imports, BoP)
2015,2014,2013,2012,2011,2010,2009,2008,2007,2006,2005,2004,2003,2002,2001,2000,1999,1998,1997,1996,1995,1994,1993,1992,1991,1990,1989,1988,1987,1986,1985,1984,1983,1982,1981,1980,1979,1978,1977,1976,1975
This statistics in other country:
AfghanistanAlbaniaAlgeriaAngolaAntigua and BarbudaArab WorldArgentinaArmeniaArubaAustraliaAustriaAzerbaijanBahamas, TheBahrainBangladeshBarbadosBelarusBelgiumBelizeBeninBermudaBhutanBoliviaBosnia and HerzegovinaBotswanaBrazilBrunei DarussalamBulgariaBurkina FasoBurundiCabo VerdeCambodiaCameroonCanadaCaribbean small statesCentral African RepublicCentral Europe and the BalticsChadChileChinaColombiaComorosCongo, Dem. Rep.Congo, Rep.Costa RicaCote d'IvoireCroatiaCuracaoCyprusCzech RepublicDenmarkDjiboutiDominicaDominican RepublicEarly-demographic dividendEast Asia & PacificEast Asia & Pacific (excluding high income)East Asia & Pacific (IDA & IBRD countries)EcuadorEgypt, Arab Rep.El SalvadorEquatorial GuineaEritreaEstoniaEthiopiaEuro areaEurope & Central AsiaEurope & Central Asia (excluding high income)Europe & Central Asia (IDA & IBRD countries)European UnionFaroe IslandsFijiFinlandFragile and conflict affected situationsFranceFrench PolynesiaGabonGambia, TheGeorgiaGermanyGhanaGreeceGrenadaGuatemalaGuineaGuinea-BissauGuyanaHaitiHeavily indebted poor countries (HIPC)High incomeHondurasHong Kong SAR, ChinaHungaryIBRD onlyIcelandIDA & IBRD totalIDA onlyIDA totalIndiaIndonesiaIran, Islamic Rep.IraqIrelandIsraelItalyJamaicaJapanJordanKazakhstanKenyaKiribatiKorea, Rep.KosovoKuwaitKyrgyz RepublicLao PDRLate-demographic dividendLatin America & Caribbean Latin America & Caribbean (excluding high income)Latin America & the Caribbean (IDA & IBRD countries)LatviaLeast developed countries: UN classificationLebanonLesothoLiberiaLibyaLithuaniaLow & middle incomeLow incomeLower middle incomeLuxembourgMacao SAR, ChinaMacedonia, FYRMadagascarMalawiMalaysiaMaldivesMaliMaltaMarshall IslandsMauritaniaMauritiusMexicoMicronesia, Fed. Sts.Middle East & North AfricaMiddle East & North Africa (excluding high income)Middle East & North Africa (IDA & IBRD countries)Middle incomeMoldovaMongoliaMontenegroMoroccoMozambiqueMyanmarNamibiaNepalNetherlandsNew CaledoniaNew ZealandNicaraguaNigerNigeriaNorth AmericaNorwayOECD membersOmanOther small statesPacific island small statesPakistanPalauPanamaPapua New GuineaParaguayPeruPhilippinesPolandPortugalPost-demographic dividendPre-demographic dividendQatarRomaniaRussian FederationRwandaSamoaSao Tome and PrincipeSaudi ArabiaSenegalSerbiaSeychellesSierra LeoneSingaporeSint Maarten (Dutch part)Slovak RepublicSloveniaSmall statesSolomon IslandsSouth AfricaSouth AsiaSouth Asia (IDA & IBRD)South SudanSpainSri LankaSt. Kitts and NevisSt. LuciaSt. Vincent and the GrenadinesSub-Saharan Africa Sub-Saharan Africa (excluding high income)Sub-Saharan Africa (IDA & IBRD countries)SudanSurinameSwazilandSwedenSwitzerlandSyrian Arab RepublicTajikistanTanzaniaThailandTimor-LesteTogoTongaTrinidad and TobagoTunisiaTurkeyTuvaluUgandaUkraineUnited KingdomUnited StatesUpper middle incomeUruguayVanuatuVenezuela, RBWest Bank and GazaWorldYemen, Rep.ZambiaZimbabwe Timeline:
This timeline shows a graph from 1975 to 2015 of Swaziland. No data until 1974. Number of actual observations by date: 41.
Source name:
World Development Indicators
Source organization:
International Monetary Fund, Balance of Payments Statistics Yearbook and data files.
Categories, topics:
Economy & Growth, Trade
Last updated:
apr 23, 2017
Indicators value changes by year
Maximum:
82.248
jan 1, 2012
At the date of observation
Value
Absolute change
Change from previous value
jan 1, 1975
51.531
+51.531
0.0%
jan 1, 1976
44.521
-7.01
-13.6%
jan 1, 1977
44.809
+0.288
0.65%
jan 1, 1978
50.0
+5.191
11.59%
jan 1, 1979
53.249
+3.249
6.5%
jan 1, 1980
59.201
+5.952
11.18%
jan 1, 1981
51.846
-7.355
-12.42%
jan 1, 1982
47.738
-4.108
-7.92%
jan 1, 1983
51.201
+3.463
7.25%
jan 1, 1984
44.498
-6.703
-13.09%
jan 1, 1985
55.251
+10.753
24.16%
jan 1, 1986
60.259
+5.008
9.06%
jan 1, 1987
53.215
-7.044
-11.69%
jan 1, 1988
57.278
+4.063
7.64%
jan 1, 1989
53.369
-3.909
-6.82%
jan 1, 1990
49.513
-3.857
-7.23%
jan 1, 1991
75.005
+25.493
51.49%
jan 1, 1992
72.935
-2.07
-2.76%
jan 1, 1993
72.473
-0.462
-0.63%
jan 1, 1994
74.625
+2.152
2.97%
jan 1, 1995
68.543
-6.082
-8.15%
jan 1, 1996
64.334
-4.209
-6.14%
jan 1, 1997
76.83
+12.496
19.42%
jan 1, 1998
75.387
-1.443
-1.88%
jan 1, 1999
72.15
-3.237
-4.29%
jan 1, 2000
66.786
-5.364
-7.43%
jan 1, 2001
81.151
+14.365
21.51%
jan 1, 2002
69.638
-11.512
-14.19%
jan 1, 2003
69.104
-0.535
-0.77%
jan 1, 2004
70.697
+1.593
2.31%
jan 1, 2005
45.003
-25.694
-36.34%
jan 1, 2006
43.28
-1.723
-3.83%
jan 1, 2007
58.016
+14.736
34.05%
jan 1, 2008
66.572
+8.556
14.75%
jan 1, 2009
63.058
-3.514
-5.28%
jan 1, 2010
49.9
-13.158
-20.87%
jan 1, 2011
75.126
+25.226
50.55%
jan 1, 2012
82.248
+7.122
9.48%
jan 1, 2013
80.017
-2.231
-2.71%
jan 1, 2014
77.402
-2.615
-3.27%
jan 1, 2015
73.847
-3.555
-4.59%
Ranking of countries by current statistics by years


Comments: