29
/
en
AIzaSyAYiBZKx7MnpbEhh9jyipgxe19OcubqV5w
April 1, 2024
232033
Samoa
WSM
true
2
1
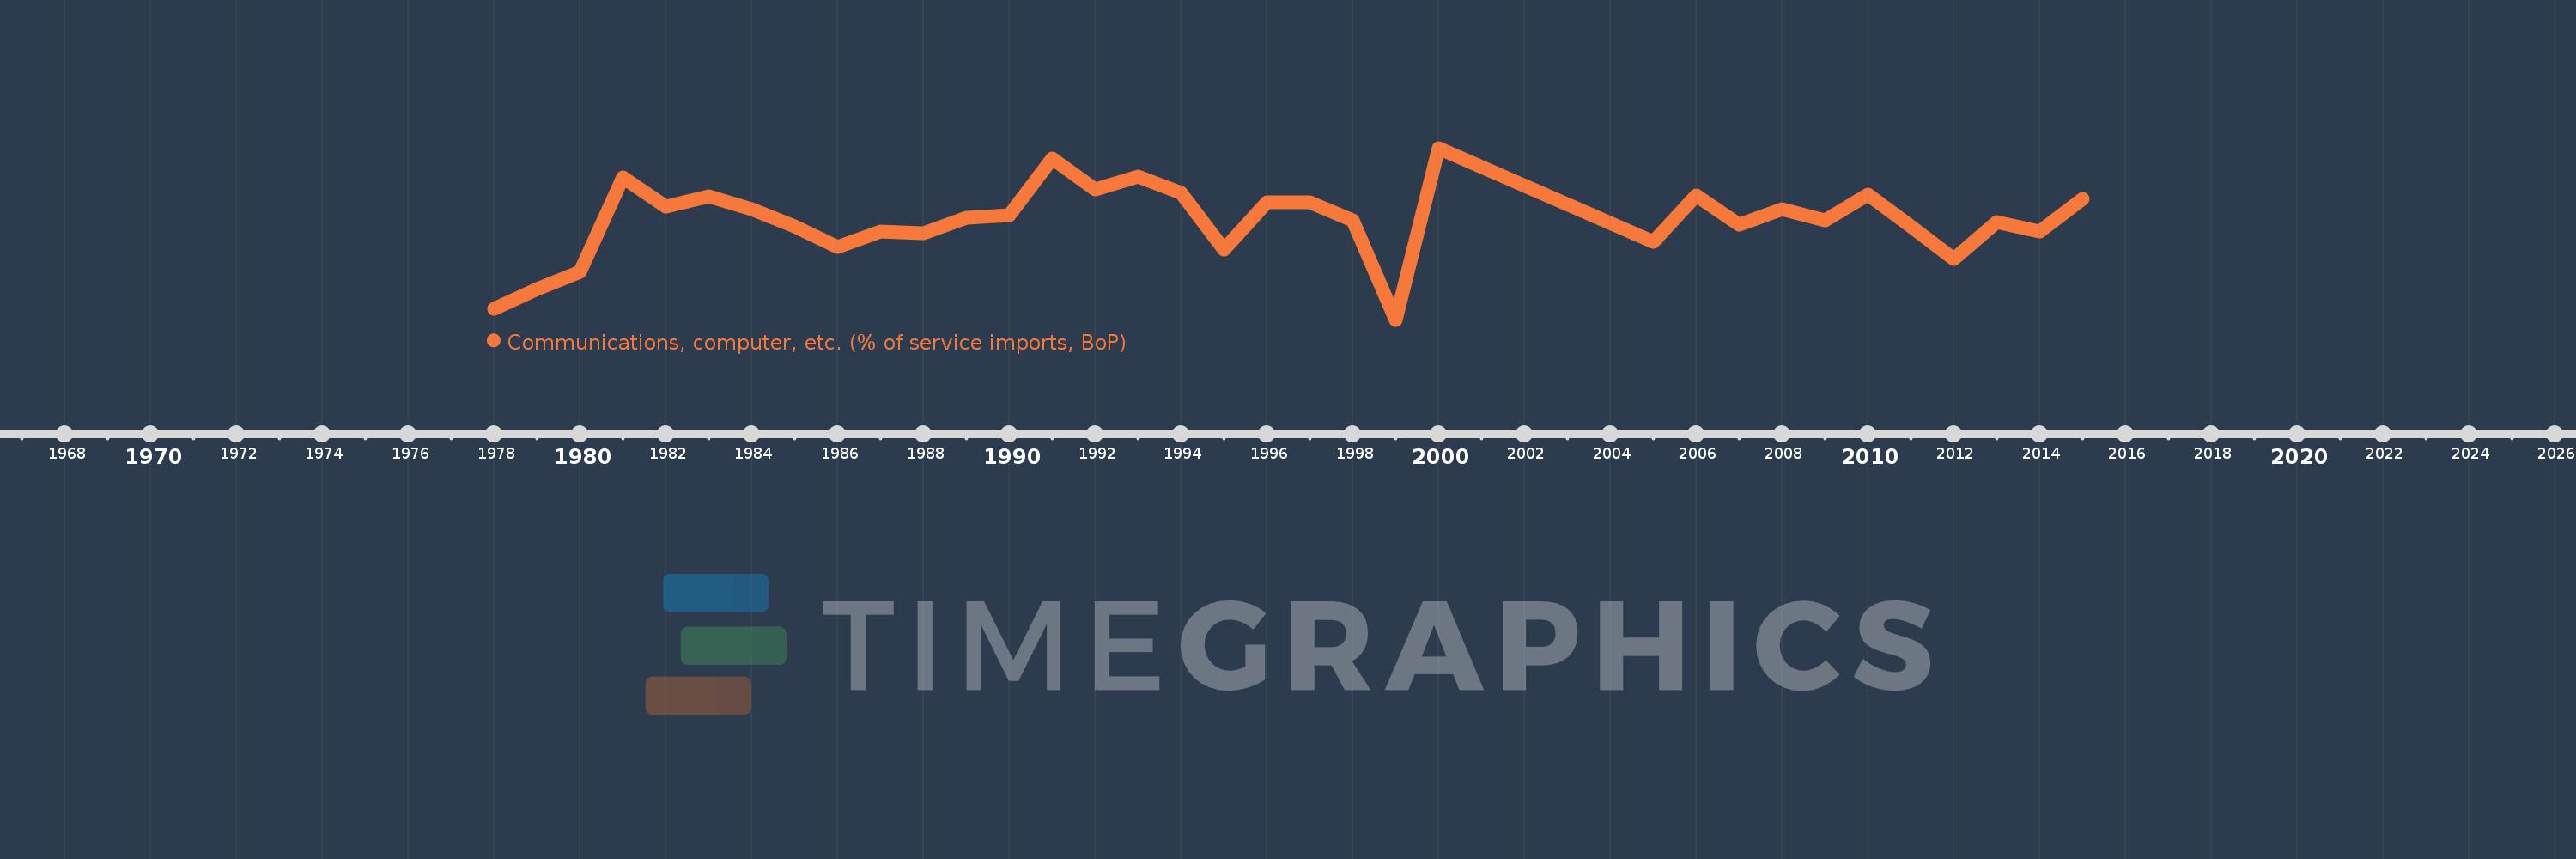
Communications, computer, etc. (% of service imports, BoP)
2015,2014,2013,2012,2011,2010,2009,2008,2007,2006,2005,2000,1999,1998,1997,1996,1995,1994,1993,1992,1991,1990,1989,1988,1987,1986,1985,1984,1983,1982,1981,1980,1979,1978
This statistics in other country:
AfghanistanAlbaniaAlgeriaAngolaAntigua and BarbudaArab WorldArgentinaArmeniaArubaAustraliaAustriaAzerbaijanBahamas, TheBahrainBangladeshBarbadosBelarusBelgiumBelizeBeninBermudaBhutanBoliviaBosnia and HerzegovinaBotswanaBrazilBrunei DarussalamBulgariaBurkina FasoBurundiCabo VerdeCambodiaCameroonCanadaCaribbean small statesCentral African RepublicCentral Europe and the BalticsChadChileChinaColombiaComorosCongo, Dem. Rep.Congo, Rep.Costa RicaCote d'IvoireCroatiaCuracaoCyprusCzech RepublicDenmarkDjiboutiDominicaDominican RepublicEarly-demographic dividendEast Asia & PacificEast Asia & Pacific (excluding high income)East Asia & Pacific (IDA & IBRD countries)EcuadorEgypt, Arab Rep.El SalvadorEquatorial GuineaEritreaEstoniaEthiopiaEuro areaEurope & Central AsiaEurope & Central Asia (excluding high income)Europe & Central Asia (IDA & IBRD countries)European UnionFaroe IslandsFijiFinlandFragile and conflict affected situationsFranceFrench PolynesiaGabonGambia, TheGeorgiaGermanyGhanaGreeceGrenadaGuatemalaGuineaGuinea-BissauGuyanaHaitiHeavily indebted poor countries (HIPC)High incomeHondurasHong Kong SAR, ChinaHungaryIBRD onlyIcelandIDA & IBRD totalIDA onlyIDA totalIndiaIndonesiaIran, Islamic Rep.IraqIrelandIsraelItalyJamaicaJapanJordanKazakhstanKenyaKiribatiKorea, Rep.KosovoKuwaitKyrgyz RepublicLao PDRLate-demographic dividendLatin America & Caribbean Latin America & Caribbean (excluding high income)Latin America & the Caribbean (IDA & IBRD countries)LatviaLeast developed countries: UN classificationLebanonLesothoLiberiaLibyaLithuaniaLow & middle incomeLow incomeLower middle incomeLuxembourgMacao SAR, ChinaMacedonia, FYRMadagascarMalawiMalaysiaMaldivesMaliMaltaMarshall IslandsMauritaniaMauritiusMexicoMicronesia, Fed. Sts.Middle East & North AfricaMiddle East & North Africa (excluding high income)Middle East & North Africa (IDA & IBRD countries)Middle incomeMoldovaMongoliaMontenegroMoroccoMozambiqueMyanmarNamibiaNepalNetherlandsNew CaledoniaNew ZealandNicaraguaNigerNigeriaNorth AmericaNorwayOECD membersOmanOther small statesPacific island small statesPakistanPalauPanamaPapua New GuineaParaguayPeruPhilippinesPolandPortugalPost-demographic dividendPre-demographic dividendQatarRomaniaRussian FederationRwandaSamoaSao Tome and PrincipeSaudi ArabiaSenegalSerbiaSeychellesSierra LeoneSingaporeSint Maarten (Dutch part)Slovak RepublicSloveniaSmall statesSolomon IslandsSouth AfricaSouth AsiaSouth Asia (IDA & IBRD)South SudanSpainSri LankaSt. Kitts and NevisSt. LuciaSt. Vincent and the GrenadinesSub-Saharan Africa Sub-Saharan Africa (excluding high income)Sub-Saharan Africa (IDA & IBRD countries)SudanSurinameSwazilandSwedenSwitzerlandSyrian Arab RepublicTajikistanTanzaniaThailandTimor-LesteTogoTongaTrinidad and TobagoTunisiaTurkeyTuvaluUgandaUkraineUnited KingdomUnited StatesUpper middle incomeUruguayVanuatuVenezuela, RBWest Bank and GazaWorldYemen, Rep.ZambiaZimbabwe Timeline:
This timeline shows a graph from 1978 to 2015 of Samoa. No data until 1977. Number of actual observations by date: 34.
Source name:
World Development Indicators
Source organization:
International Monetary Fund, Balance of Payments Statistics Yearbook and data files.
Categories, topics:
Economy & Growth, Trade
Last updated:
apr 23, 2017
Indicators value changes by year
Minimum:
12.153
jan 1, 1999
Maximum:
56.739
jan 1, 2000
At the date of observation
Value
Absolute change
Change from previous value
jan 1, 1978
15.0
+15.0
0.0%
jan 1, 1979
20.08
+5.08
33.87%
jan 1, 1980
24.48
+4.399
21.91%
jan 1, 1981
49.122
+24.642
100.66%
jan 1, 1982
41.569
-7.552
-15.37%
jan 1, 1983
44.087
+2.517
6.06%
jan 1, 1984
40.871
-3.215
-7.29%
jan 1, 1985
36.316
-4.556
-11.15%
jan 1, 1986
31.137
-5.179
-14.26%
jan 1, 1987
35.128
+3.991
12.82%
jan 1, 1988
34.617
-0.512
-1.46%
jan 1, 1989
38.514
+3.898
11.26%
jan 1, 1990
39.348
+0.834
2.17%
jan 1, 1991
54.071
+14.722
37.41%
jan 1, 1992
45.949
-8.121
-15.02%
jan 1, 1993
49.276
+3.327
7.24%
jan 1, 1994
45.139
-4.137
-8.4%
jan 1, 1995
30.476
-14.663
-32.48%
jan 1, 1996
42.677
+12.2
40.03%
jan 1, 1997
42.593
-0.083
-0.19%
jan 1, 1998
37.863
-4.73
-11.11%
jan 1, 1999
12.153
-25.71
-67.9%
jan 1, 2000
56.739
+44.586
366.87%
jan 1, 2005
32.448
-24.291
-42.81%
jan 1, 2006
44.418
+11.97
36.89%
jan 1, 2007
36.829
-7.589
-17.09%
jan 1, 2008
40.809
+3.98
10.81%
jan 1, 2009
38.015
-2.794
-6.85%
jan 1, 2010
44.523
+6.508
17.12%
jan 1, 2011
36.375
-8.148
-18.3%
jan 1, 2012
28.014
-8.361
-22.99%
jan 1, 2013
37.525
+9.511
33.95%
jan 1, 2014
35.031
-2.494
-6.65%
jan 1, 2015
43.517
+8.485
24.22%
Ranking of countries by current statistics by years


Comments: