29
/
en
AIzaSyAYiBZKx7MnpbEhh9jyipgxe19OcubqV5w
April 1, 2024
173907
Lao PDR
LAO
true
2
1
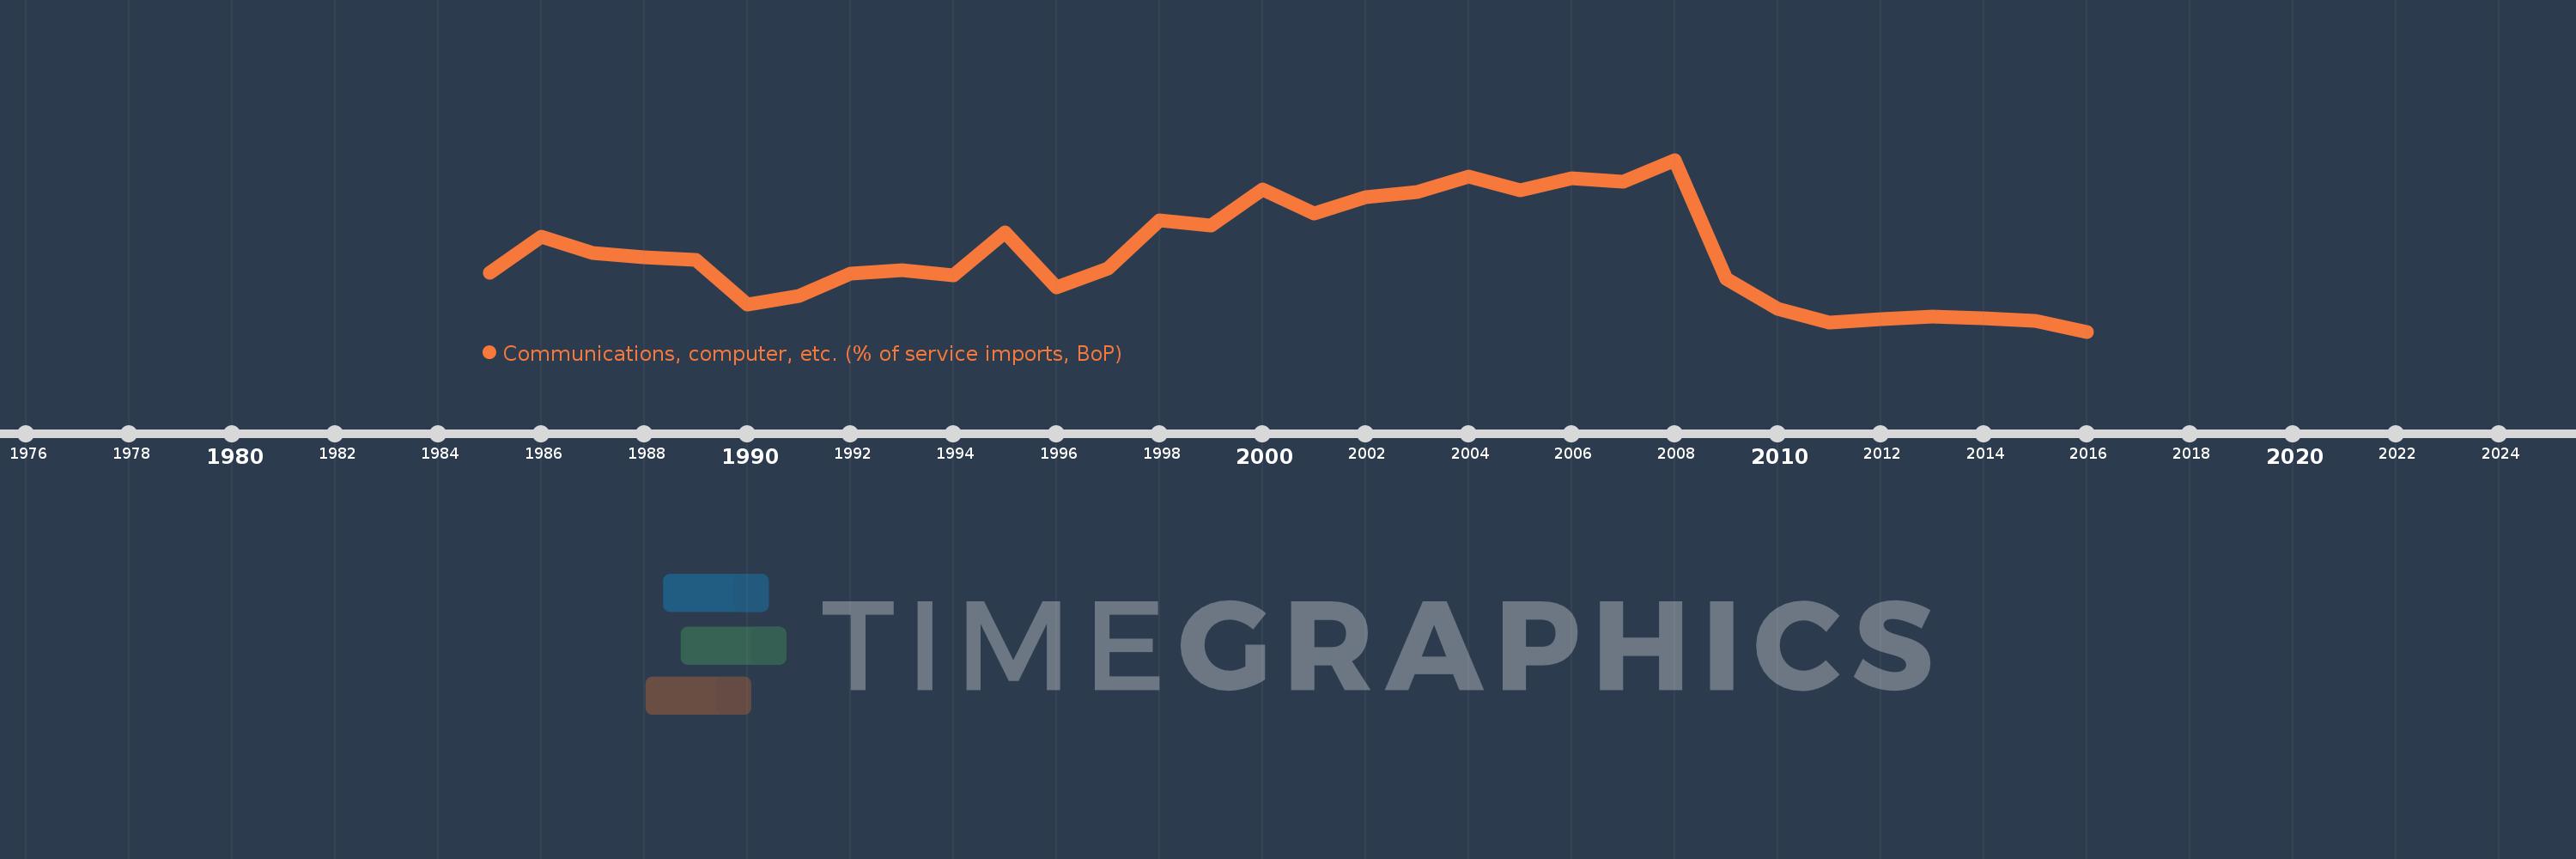
Communications, computer, etc. (% of service imports, BoP)
2016,2015,2014,2013,2012,2011,2010,2009,2008,2007,2006,2005,2004,2003,2002,2001,2000,1999,1998,1997,1996,1995,1994,1993,1992,1991,1990,1989,1988,1987,1986,1985
This statistics in other country:
AfghanistanAlbaniaAlgeriaAngolaAntigua and BarbudaArab WorldArgentinaArmeniaArubaAustraliaAustriaAzerbaijanBahamas, TheBahrainBangladeshBarbadosBelarusBelgiumBelizeBeninBermudaBhutanBoliviaBosnia and HerzegovinaBotswanaBrazilBrunei DarussalamBulgariaBurkina FasoBurundiCabo VerdeCambodiaCameroonCanadaCaribbean small statesCentral African RepublicCentral Europe and the BalticsChadChileChinaColombiaComorosCongo, Dem. Rep.Congo, Rep.Costa RicaCote d'IvoireCroatiaCuracaoCyprusCzech RepublicDenmarkDjiboutiDominicaDominican RepublicEarly-demographic dividendEast Asia & PacificEast Asia & Pacific (excluding high income)East Asia & Pacific (IDA & IBRD countries)EcuadorEgypt, Arab Rep.El SalvadorEquatorial GuineaEritreaEstoniaEthiopiaEuro areaEurope & Central AsiaEurope & Central Asia (excluding high income)Europe & Central Asia (IDA & IBRD countries)European UnionFaroe IslandsFijiFinlandFragile and conflict affected situationsFranceFrench PolynesiaGabonGambia, TheGeorgiaGermanyGhanaGreeceGrenadaGuatemalaGuineaGuinea-BissauGuyanaHaitiHeavily indebted poor countries (HIPC)High incomeHondurasHong Kong SAR, ChinaHungaryIBRD onlyIcelandIDA & IBRD totalIDA onlyIDA totalIndiaIndonesiaIran, Islamic Rep.IraqIrelandIsraelItalyJamaicaJapanJordanKazakhstanKenyaKiribatiKorea, Rep.KosovoKuwaitKyrgyz RepublicLao PDRLate-demographic dividendLatin America & Caribbean Latin America & Caribbean (excluding high income)Latin America & the Caribbean (IDA & IBRD countries)LatviaLeast developed countries: UN classificationLebanonLesothoLiberiaLibyaLithuaniaLow & middle incomeLow incomeLower middle incomeLuxembourgMacao SAR, ChinaMacedonia, FYRMadagascarMalawiMalaysiaMaldivesMaliMaltaMarshall IslandsMauritaniaMauritiusMexicoMicronesia, Fed. Sts.Middle East & North AfricaMiddle East & North Africa (excluding high income)Middle East & North Africa (IDA & IBRD countries)Middle incomeMoldovaMongoliaMontenegroMoroccoMozambiqueMyanmarNamibiaNepalNetherlandsNew CaledoniaNew ZealandNicaraguaNigerNigeriaNorth AmericaNorwayOECD membersOmanOther small statesPacific island small statesPakistanPalauPanamaPapua New GuineaParaguayPeruPhilippinesPolandPortugalPost-demographic dividendPre-demographic dividendQatarRomaniaRussian FederationRwandaSamoaSao Tome and PrincipeSaudi ArabiaSenegalSerbiaSeychellesSierra LeoneSingaporeSint Maarten (Dutch part)Slovak RepublicSloveniaSmall statesSolomon IslandsSouth AfricaSouth AsiaSouth Asia (IDA & IBRD)South SudanSpainSri LankaSt. Kitts and NevisSt. LuciaSt. Vincent and the GrenadinesSub-Saharan Africa Sub-Saharan Africa (excluding high income)Sub-Saharan Africa (IDA & IBRD countries)SudanSurinameSwazilandSwedenSwitzerlandSyrian Arab RepublicTajikistanTanzaniaThailandTimor-LesteTogoTongaTrinidad and TobagoTunisiaTurkeyTuvaluUgandaUkraineUnited KingdomUnited StatesUpper middle incomeUruguayVanuatuVenezuela, RBWest Bank and GazaWorldYemen, Rep.ZambiaZimbabwe Timeline:
This timeline shows a graph from 1985 to 2016 of Lao PDR. No data until 1984. Number of actual observations by date: 32.
Source name:
World Development Indicators
Source organization:
International Monetary Fund, Balance of Payments Statistics Yearbook and data files.
Categories, topics:
Economy & Growth, Trade
Last updated:
apr 23, 2017
Indicators value changes by year
Maximum:
99.129
jan 1, 2008
At the date of observation
Value
Absolute change
Change from previous value
jan 1, 1985
37.217
+37.217
0.0%
jan 1, 1986
56.876
+19.659
52.82%
jan 1, 1987
47.633
-9.243
-16.25%
jan 1, 1988
45.669
-1.964
-4.12%
jan 1, 1989
44.195
-1.475
-3.23%
jan 1, 1990
19.38
-24.815
-56.15%
jan 1, 1991
24.242
+4.863
25.09%
jan 1, 1992
36.345
+12.102
49.92%
jan 1, 1993
38.429
+2.085
5.74%
jan 1, 1994
35.441
-2.988
-7.77%
jan 1, 1995
59.106
+23.664
66.77%
jan 1, 1996
29.194
-29.912
-50.61%
jan 1, 1997
39.206
+10.012
34.3%
jan 1, 1998
65.71
+26.504
67.6%
jan 1, 1999
62.967
-2.743
-4.17%
jan 1, 2000
83.012
+20.044
31.83%
jan 1, 2001
69.803
-13.209
-15.91%
jan 1, 2002
78.682
+8.88
12.72%
jan 1, 2003
81.262
+2.579
3.28%
jan 1, 2004
90.138
+8.876
10.92%
jan 1, 2005
82.241
-7.896
-8.76%
jan 1, 2006
89.019
+6.777
8.24%
jan 1, 2007
87.253
-1.766
-1.98%
jan 1, 2008
99.129
+11.876
13.61%
jan 1, 2009
33.72
-65.409
-65.98%
jan 1, 2010
17.261
-16.459
-48.81%
jan 1, 2011
9.574
-7.687
-44.53%
jan 1, 2012
11.285
+1.711
17.88%
jan 1, 2013
13.116
+1.831
16.23%
jan 1, 2014
11.88
-1.236
-9.42%
jan 1, 2015
10.343
-1.538
-12.94%
jan 1, 2016
4.637
-5.706
-55.17%
Ranking of countries by current statistics by years


Comments: