29
/
en
AIzaSyAYiBZKx7MnpbEhh9jyipgxe19OcubqV5w
April 1, 2024
77995
Bangladesh
BGD
true
2
1
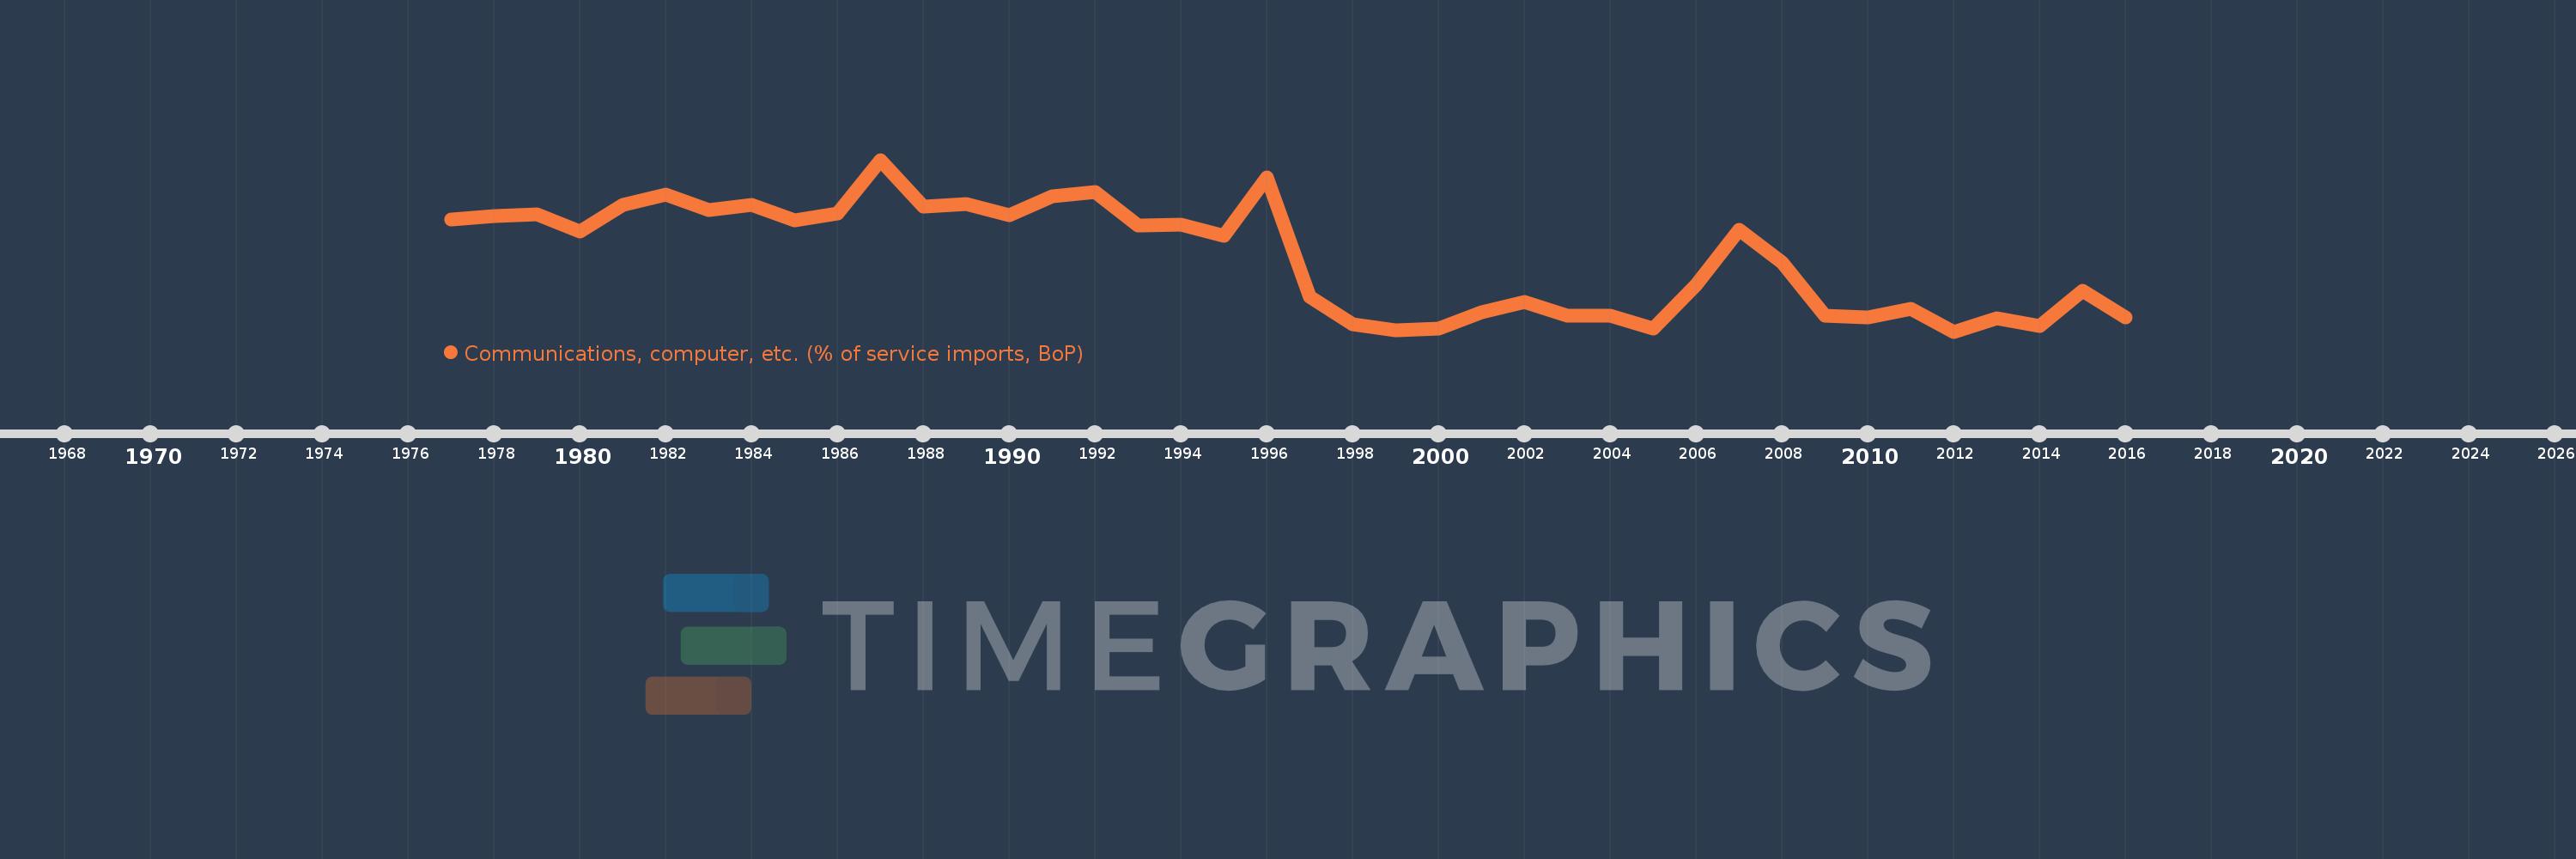
Communications, computer, etc. (% of service imports, BoP)
2016,2015,2014,2013,2012,2011,2010,2009,2008,2007,2006,2005,2004,2003,2002,2001,2000,1999,1998,1997,1996,1995,1994,1993,1992,1991,1990,1989,1988,1987,1986,1985,1984,1983,1982,1981,1980,1979,1978,1977
This statistics in other country:
AfghanistanAlbaniaAlgeriaAngolaAntigua and BarbudaArab WorldArgentinaArmeniaArubaAustraliaAustriaAzerbaijanBahamas, TheBahrainBangladeshBarbadosBelarusBelgiumBelizeBeninBermudaBhutanBoliviaBosnia and HerzegovinaBotswanaBrazilBrunei DarussalamBulgariaBurkina FasoBurundiCabo VerdeCambodiaCameroonCanadaCaribbean small statesCentral African RepublicCentral Europe and the BalticsChadChileChinaColombiaComorosCongo, Dem. Rep.Congo, Rep.Costa RicaCote d'IvoireCroatiaCuracaoCyprusCzech RepublicDenmarkDjiboutiDominicaDominican RepublicEarly-demographic dividendEast Asia & PacificEast Asia & Pacific (excluding high income)East Asia & Pacific (IDA & IBRD countries)EcuadorEgypt, Arab Rep.El SalvadorEquatorial GuineaEritreaEstoniaEthiopiaEuro areaEurope & Central AsiaEurope & Central Asia (excluding high income)Europe & Central Asia (IDA & IBRD countries)European UnionFaroe IslandsFijiFinlandFragile and conflict affected situationsFranceFrench PolynesiaGabonGambia, TheGeorgiaGermanyGhanaGreeceGrenadaGuatemalaGuineaGuinea-BissauGuyanaHaitiHeavily indebted poor countries (HIPC)High incomeHondurasHong Kong SAR, ChinaHungaryIBRD onlyIcelandIDA & IBRD totalIDA onlyIDA totalIndiaIndonesiaIran, Islamic Rep.IraqIrelandIsraelItalyJamaicaJapanJordanKazakhstanKenyaKiribatiKorea, Rep.KosovoKuwaitKyrgyz RepublicLao PDRLate-demographic dividendLatin America & Caribbean Latin America & Caribbean (excluding high income)Latin America & the Caribbean (IDA & IBRD countries)LatviaLeast developed countries: UN classificationLebanonLesothoLiberiaLibyaLithuaniaLow & middle incomeLow incomeLower middle incomeLuxembourgMacao SAR, ChinaMacedonia, FYRMadagascarMalawiMalaysiaMaldivesMaliMaltaMarshall IslandsMauritaniaMauritiusMexicoMicronesia, Fed. Sts.Middle East & North AfricaMiddle East & North Africa (excluding high income)Middle East & North Africa (IDA & IBRD countries)Middle incomeMoldovaMongoliaMontenegroMoroccoMozambiqueMyanmarNamibiaNepalNetherlandsNew CaledoniaNew ZealandNicaraguaNigerNigeriaNorth AmericaNorwayOECD membersOmanOther small statesPacific island small statesPakistanPalauPanamaPapua New GuineaParaguayPeruPhilippinesPolandPortugalPost-demographic dividendPre-demographic dividendQatarRomaniaRussian FederationRwandaSamoaSao Tome and PrincipeSaudi ArabiaSenegalSerbiaSeychellesSierra LeoneSingaporeSint Maarten (Dutch part)Slovak RepublicSloveniaSmall statesSolomon IslandsSouth AfricaSouth AsiaSouth Asia (IDA & IBRD)South SudanSpainSri LankaSt. Kitts and NevisSt. LuciaSt. Vincent and the GrenadinesSub-Saharan Africa Sub-Saharan Africa (excluding high income)Sub-Saharan Africa (IDA & IBRD countries)SudanSurinameSwazilandSwedenSwitzerlandSyrian Arab RepublicTajikistanTanzaniaThailandTimor-LesteTogoTongaTrinidad and TobagoTunisiaTurkeyTuvaluUgandaUkraineUnited KingdomUnited StatesUpper middle incomeUruguayVanuatuVenezuela, RBWest Bank and GazaWorldYemen, Rep.ZambiaZimbabwe Timeline:
This timeline shows a graph from 1977 to 2016 of Bangladesh. No data until 1976. Number of actual observations by date: 40.
Source name:
World Development Indicators
Source organization:
International Monetary Fund, Balance of Payments Statistics Yearbook and data files.
Categories, topics:
Economy & Growth, Trade
Last updated:
apr 23, 2017
Indicators value changes by year
Minimum:
11.269
jan 1, 2012
Maximum:
31.788
jan 1, 1987
At the date of observation
Value
Absolute change
Change from previous value
jan 1, 1977
24.699
+24.699
0.0%
jan 1, 1978
25.099
+0.4
1.62%
jan 1, 1979
25.277
+0.178
0.71%
jan 1, 1980
23.189
-2.088
-8.26%
jan 1, 1981
26.372
+3.183
13.73%
jan 1, 1982
27.634
+1.262
4.79%
jan 1, 1983
25.757
-1.877
-6.79%
jan 1, 1984
26.367
+0.609
2.37%
jan 1, 1985
24.584
-1.783
-6.76%
jan 1, 1986
25.335
+0.751
3.05%
jan 1, 1987
31.788
+6.452
25.47%
jan 1, 1988
26.201
-5.586
-17.57%
jan 1, 1989
26.51
+0.309
1.18%
jan 1, 1990
25.198
-1.312
-4.95%
jan 1, 1991
27.41
+2.212
8.78%
jan 1, 1992
27.975
+0.565
2.06%
jan 1, 1993
23.954
-4.021
-14.37%
jan 1, 1994
24.06
+0.106
0.44%
jan 1, 1995
22.757
-1.303
-5.41%
jan 1, 1996
29.727
+6.97
30.63%
jan 1, 1997
15.463
-14.264
-47.98%
jan 1, 1998
12.133
-3.33
-21.53%
jan 1, 1999
11.456
-0.678
-5.58%
jan 1, 2000
11.581
+0.125
1.09%
jan 1, 2001
13.546
+1.966
16.97%
jan 1, 2002
14.767
+1.221
9.01%
jan 1, 2003
13.208
-1.559
-10.56%
jan 1, 2004
13.172
-0.036
-0.27%
jan 1, 2005
11.665
-1.508
-11.45%
jan 1, 2006
16.859
+5.195
44.53%
jan 1, 2007
23.429
+6.57
38.97%
jan 1, 2008
19.499
-3.93
-16.77%
jan 1, 2009
13.202
-6.297
-32.3%
jan 1, 2010
12.959
-0.243
-1.84%
jan 1, 2011
14.013
+1.054
8.14%
jan 1, 2012
11.269
-2.744
-19.58%
jan 1, 2013
12.837
+1.568
13.91%
jan 1, 2014
11.934
-0.903
-7.04%
jan 1, 2015
16.124
+4.19
35.11%
jan 1, 2016
12.911
-3.213
-19.92%
Ranking of countries by current statistics by years


Comments: