29
/
en
AIzaSyAYiBZKx7MnpbEhh9jyipgxe19OcubqV5w
April 1, 2024
79278
Barbados
BRB
true
2
1
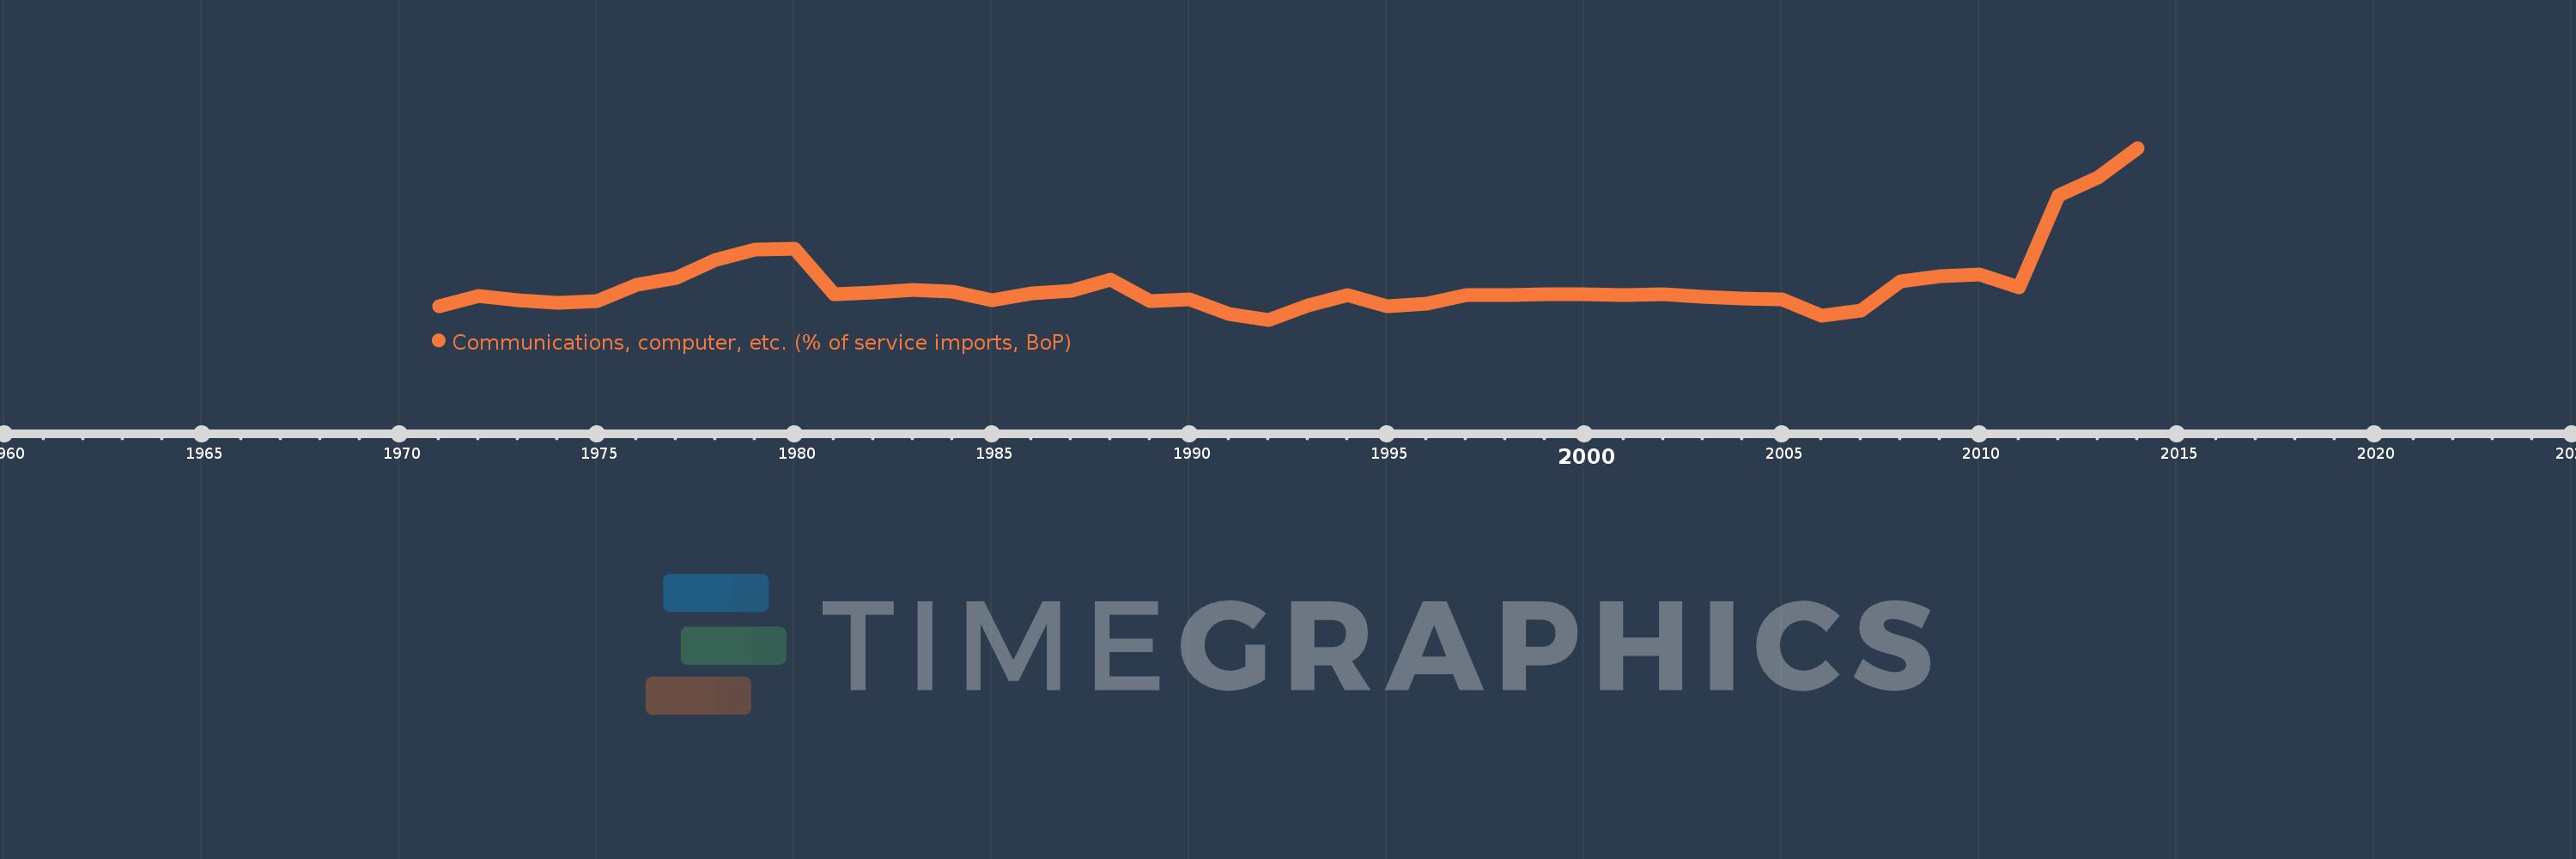
Communications, computer, etc. (% of service imports, BoP)
2014,2013,2012,2011,2010,2009,2008,2007,2006,2005,2004,2003,2002,2001,2000,1999,1998,1997,1996,1995,1994,1993,1992,1991,1990,1989,1988,1987,1986,1985,1984,1983,1982,1981,1980,1979,1978,1977,1976,1975,1974,1973,1972,1971
This statistics in other country:
AfghanistanAlbaniaAlgeriaAngolaAntigua and BarbudaArab WorldArgentinaArmeniaArubaAustraliaAustriaAzerbaijanBahamas, TheBahrainBangladeshBarbadosBelarusBelgiumBelizeBeninBermudaBhutanBoliviaBosnia and HerzegovinaBotswanaBrazilBrunei DarussalamBulgariaBurkina FasoBurundiCabo VerdeCambodiaCameroonCanadaCaribbean small statesCentral African RepublicCentral Europe and the BalticsChadChileChinaColombiaComorosCongo, Dem. Rep.Congo, Rep.Costa RicaCote d'IvoireCroatiaCuracaoCyprusCzech RepublicDenmarkDjiboutiDominicaDominican RepublicEarly-demographic dividendEast Asia & PacificEast Asia & Pacific (excluding high income)East Asia & Pacific (IDA & IBRD countries)EcuadorEgypt, Arab Rep.El SalvadorEquatorial GuineaEritreaEstoniaEthiopiaEuro areaEurope & Central AsiaEurope & Central Asia (excluding high income)Europe & Central Asia (IDA & IBRD countries)European UnionFaroe IslandsFijiFinlandFragile and conflict affected situationsFranceFrench PolynesiaGabonGambia, TheGeorgiaGermanyGhanaGreeceGrenadaGuatemalaGuineaGuinea-BissauGuyanaHaitiHeavily indebted poor countries (HIPC)High incomeHondurasHong Kong SAR, ChinaHungaryIBRD onlyIcelandIDA & IBRD totalIDA onlyIDA totalIndiaIndonesiaIran, Islamic Rep.IraqIrelandIsraelItalyJamaicaJapanJordanKazakhstanKenyaKiribatiKorea, Rep.KosovoKuwaitKyrgyz RepublicLao PDRLate-demographic dividendLatin America & Caribbean Latin America & Caribbean (excluding high income)Latin America & the Caribbean (IDA & IBRD countries)LatviaLeast developed countries: UN classificationLebanonLesothoLiberiaLibyaLithuaniaLow & middle incomeLow incomeLower middle incomeLuxembourgMacao SAR, ChinaMacedonia, FYRMadagascarMalawiMalaysiaMaldivesMaliMaltaMarshall IslandsMauritaniaMauritiusMexicoMicronesia, Fed. Sts.Middle East & North AfricaMiddle East & North Africa (excluding high income)Middle East & North Africa (IDA & IBRD countries)Middle incomeMoldovaMongoliaMontenegroMoroccoMozambiqueMyanmarNamibiaNepalNetherlandsNew CaledoniaNew ZealandNicaraguaNigerNigeriaNorth AmericaNorwayOECD membersOmanOther small statesPacific island small statesPakistanPalauPanamaPapua New GuineaParaguayPeruPhilippinesPolandPortugalPost-demographic dividendPre-demographic dividendQatarRomaniaRussian FederationRwandaSamoaSao Tome and PrincipeSaudi ArabiaSenegalSerbiaSeychellesSierra LeoneSingaporeSint Maarten (Dutch part)Slovak RepublicSloveniaSmall statesSolomon IslandsSouth AfricaSouth AsiaSouth Asia (IDA & IBRD)South SudanSpainSri LankaSt. Kitts and NevisSt. LuciaSt. Vincent and the GrenadinesSub-Saharan Africa Sub-Saharan Africa (excluding high income)Sub-Saharan Africa (IDA & IBRD countries)SudanSurinameSwazilandSwedenSwitzerlandSyrian Arab RepublicTajikistanTanzaniaThailandTimor-LesteTogoTongaTrinidad and TobagoTunisiaTurkeyTuvaluUgandaUkraineUnited KingdomUnited StatesUpper middle incomeUruguayVanuatuVenezuela, RBWest Bank and GazaWorldYemen, Rep.ZambiaZimbabwe Timeline:
This timeline shows a graph from 1971 to 2014 of Barbados. No data until 1970. Number of actual observations by date: 44.
Source name:
World Development Indicators
Source organization:
International Monetary Fund, Balance of Payments Statistics Yearbook and data files.
Categories, topics:
Economy & Growth, Trade
Last updated:
apr 23, 2017
Indicators value changes by year
Minimum:
14.635
jan 1, 1992
Maximum:
73.731
jan 1, 2014
At the date of observation
Value
Absolute change
Change from previous value
jan 1, 1971
19.13
+19.13
0.0%
jan 1, 1972
22.675
+3.545
18.53%
jan 1, 1973
21.318
-1.357
-5.98%
jan 1, 1974
20.534
-0.785
-3.68%
jan 1, 1975
20.916
+0.382
1.86%
jan 1, 1976
26.743
+5.827
27.86%
jan 1, 1977
29.097
+2.354
8.8%
jan 1, 1978
35.245
+6.148
21.13%
jan 1, 1979
38.728
+3.484
9.88%
jan 1, 1980
39.155
+0.426
1.1%
jan 1, 1981
23.441
-15.714
-40.13%
jan 1, 1982
24.049
+0.608
2.6%
jan 1, 1983
24.863
+0.814
3.39%
jan 1, 1984
24.199
-0.664
-2.67%
jan 1, 1985
21.474
-2.725
-11.26%
jan 1, 1986
23.836
+2.362
11.0%
jan 1, 1987
24.569
+0.733
3.08%
jan 1, 1988
28.525
+3.956
16.1%
jan 1, 1989
21.171
-7.353
-25.78%
jan 1, 1990
21.701
+0.53
2.5%
jan 1, 1991
16.69
-5.011
-23.09%
jan 1, 1992
14.635
-2.055
-12.31%
jan 1, 1993
19.446
+4.811
32.87%
jan 1, 1994
23.162
+3.716
19.11%
jan 1, 1995
19.387
-3.775
-16.3%
jan 1, 1996
20.147
+0.76
3.92%
jan 1, 1997
23.029
+2.882
14.31%
jan 1, 1998
23.034
+0.005
0.02%
jan 1, 1999
23.544
+0.511
2.22%
jan 1, 2000
23.268
-0.277
-1.18%
jan 1, 2001
23.231
-0.037
-0.16%
jan 1, 2002
23.48
+0.249
1.07%
jan 1, 2003
22.404
-1.076
-4.58%
jan 1, 2004
21.977
-0.426
-1.9%
jan 1, 2005
21.623
-0.354
-1.61%
jan 1, 2006
15.943
-5.68
-26.27%
jan 1, 2007
17.894
+1.951
12.24%
jan 1, 2008
27.928
+10.035
56.08%
jan 1, 2009
29.542
+1.613
5.78%
jan 1, 2010
30.207
+0.666
2.25%
jan 1, 2011
25.714
-4.494
-14.88%
jan 1, 2012
57.53
+31.816
123.73%
jan 1, 2013
63.539
+6.009
10.45%
jan 1, 2014
73.731
+10.192
16.04%
Ranking of countries by current statistics by years


Comments: