29
/
en
AIzaSyAYiBZKx7MnpbEhh9jyipgxe19OcubqV5w
April 1, 2024
54634
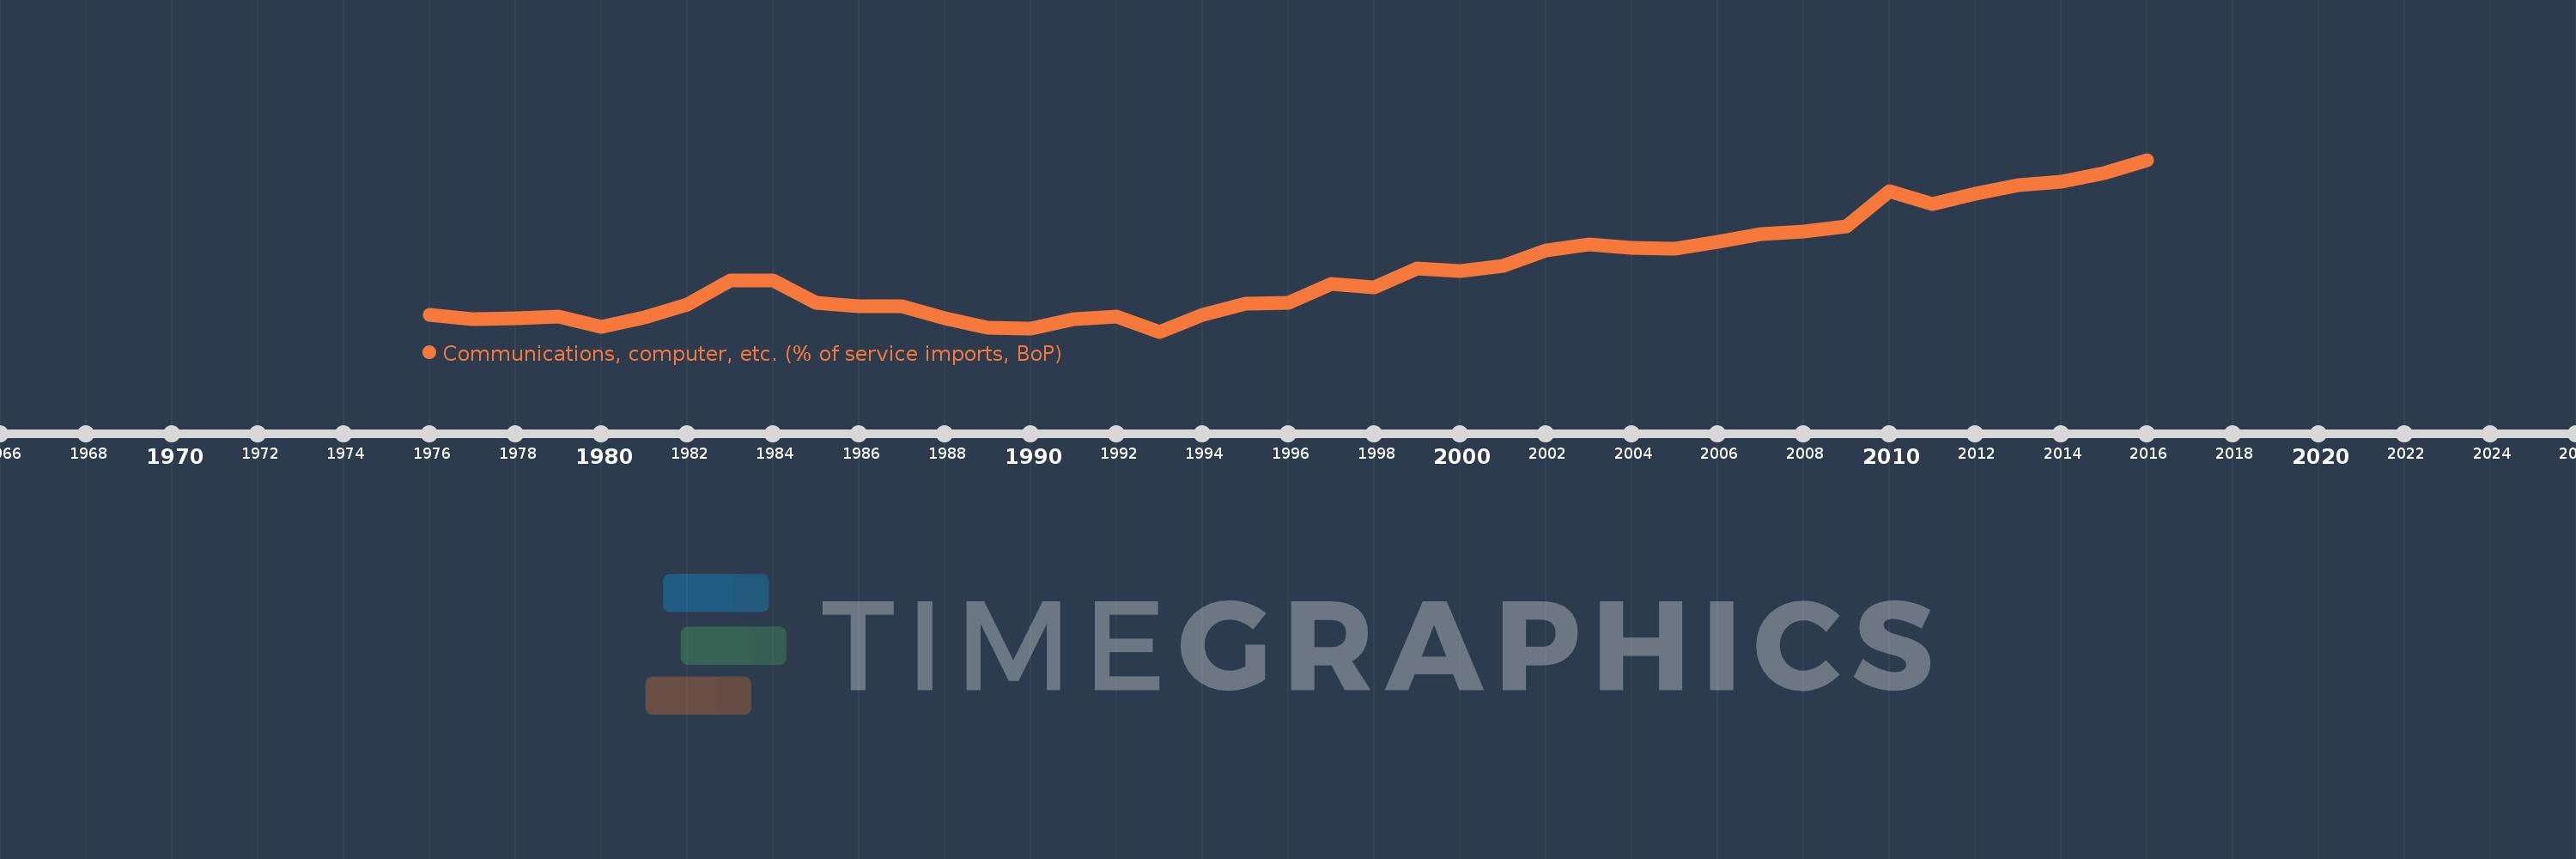
Post-demographic dividend
PST
false
2
1
Communications, computer, etc. (% of service imports, BoP)
2016,2015,2014,2013,2012,2011,2010,2009,2008,2007,2006,2005,2004,2003,2002,2001,2000,1999,1998,1997,1996,1995,1994,1993,1992,1991,1990,1989,1988,1987,1986,1985,1984,1983,1982,1981,1980,1979,1978,1977,1976
This statistics in other country:
AfghanistanAlbaniaAlgeriaAngolaAntigua and BarbudaArab WorldArgentinaArmeniaArubaAustraliaAustriaAzerbaijanBahamas, TheBahrainBangladeshBarbadosBelarusBelgiumBelizeBeninBermudaBhutanBoliviaBosnia and HerzegovinaBotswanaBrazilBrunei DarussalamBulgariaBurkina FasoBurundiCabo VerdeCambodiaCameroonCanadaCaribbean small statesCentral African RepublicCentral Europe and the BalticsChadChileChinaColombiaComorosCongo, Dem. Rep.Congo, Rep.Costa RicaCote d'IvoireCroatiaCuracaoCyprusCzech RepublicDenmarkDjiboutiDominicaDominican RepublicEarly-demographic dividendEast Asia & PacificEast Asia & Pacific (excluding high income)East Asia & Pacific (IDA & IBRD countries)EcuadorEgypt, Arab Rep.El SalvadorEquatorial GuineaEritreaEstoniaEthiopiaEuro areaEurope & Central AsiaEurope & Central Asia (excluding high income)Europe & Central Asia (IDA & IBRD countries)European UnionFaroe IslandsFijiFinlandFragile and conflict affected situationsFranceFrench PolynesiaGabonGambia, TheGeorgiaGermanyGhanaGreeceGrenadaGuatemalaGuineaGuinea-BissauGuyanaHaitiHeavily indebted poor countries (HIPC)High incomeHondurasHong Kong SAR, ChinaHungaryIBRD onlyIcelandIDA & IBRD totalIDA onlyIDA totalIndiaIndonesiaIran, Islamic Rep.IraqIrelandIsraelItalyJamaicaJapanJordanKazakhstanKenyaKiribatiKorea, Rep.KosovoKuwaitKyrgyz RepublicLao PDRLate-demographic dividendLatin America & Caribbean Latin America & Caribbean (excluding high income)Latin America & the Caribbean (IDA & IBRD countries)LatviaLeast developed countries: UN classificationLebanonLesothoLiberiaLibyaLithuaniaLow & middle incomeLow incomeLower middle incomeLuxembourgMacao SAR, ChinaMacedonia, FYRMadagascarMalawiMalaysiaMaldivesMaliMaltaMarshall IslandsMauritaniaMauritiusMexicoMicronesia, Fed. Sts.Middle East & North AfricaMiddle East & North Africa (excluding high income)Middle East & North Africa (IDA & IBRD countries)Middle incomeMoldovaMongoliaMontenegroMoroccoMozambiqueMyanmarNamibiaNepalNetherlandsNew CaledoniaNew ZealandNicaraguaNigerNigeriaNorth AmericaNorwayOECD membersOmanOther small statesPacific island small statesPakistanPalauPanamaPapua New GuineaParaguayPeruPhilippinesPolandPortugalPost-demographic dividendPre-demographic dividendQatarRomaniaRussian FederationRwandaSamoaSao Tome and PrincipeSaudi ArabiaSenegalSerbiaSeychellesSierra LeoneSingaporeSint Maarten (Dutch part)Slovak RepublicSloveniaSmall statesSolomon IslandsSouth AfricaSouth AsiaSouth Asia (IDA & IBRD)South SudanSpainSri LankaSt. Kitts and NevisSt. LuciaSt. Vincent and the GrenadinesSub-Saharan Africa Sub-Saharan Africa (excluding high income)Sub-Saharan Africa (IDA & IBRD countries)SudanSurinameSwazilandSwedenSwitzerlandSyrian Arab RepublicTajikistanTanzaniaThailandTimor-LesteTogoTongaTrinidad and TobagoTunisiaTurkeyTuvaluUgandaUkraineUnited KingdomUnited StatesUpper middle incomeUruguayVanuatuVenezuela, RBWest Bank and GazaWorldYemen, Rep.ZambiaZimbabwe Timeline:
This timeline shows a graph from 1976 to 2016 of Post-demographic dividend. No data until 1975. Number of actual observations by date: 41.
Source name:
World Development Indicators
Source organization:
International Monetary Fund, Balance of Payments Statistics Yearbook and data files.
Categories, topics:
Economy & Growth, Trade
Last updated:
apr 23, 2017
Indicators value changes by year
Minimum:
32.877
jan 1, 1993
Maximum:
48.607
jan 1, 2016
At the date of observation
Value
Absolute change
Change from previous value
jan 1, 1976
34.417
+34.417
0.0%
jan 1, 1977
34.007
-0.411
-1.19%
jan 1, 1978
34.108
+0.102
0.3%
jan 1, 1979
34.282
+0.174
0.51%
jan 1, 1980
33.303
-0.979
-2.85%
jan 1, 1981
34.164
+0.86
2.58%
jan 1, 1982
35.386
+1.222
3.58%
jan 1, 1983
37.595
+2.209
6.24%
jan 1, 1984
37.577
-0.018
-0.05%
jan 1, 1985
35.489
-2.087
-5.55%
jan 1, 1986
35.206
-0.283
-0.8%
jan 1, 1987
35.202
-0.004
-0.01%
jan 1, 1988
34.088
-1.114
-3.16%
jan 1, 1989
33.205
-0.884
-2.59%
jan 1, 1990
33.16
-0.045
-0.13%
jan 1, 1991
34.033
+0.873
2.63%
jan 1, 1992
34.231
+0.198
0.58%
jan 1, 1993
32.877
-1.355
-3.96%
jan 1, 1994
34.429
+1.553
4.72%
jan 1, 1995
35.458
+1.029
2.99%
jan 1, 1996
35.515
+0.057
0.16%
jan 1, 1997
37.254
+1.739
4.9%
jan 1, 1998
36.914
-0.34
-0.91%
jan 1, 1999
38.629
+1.715
4.65%
jan 1, 2000
38.43
-0.2
-0.52%
jan 1, 2001
38.863
+0.433
1.13%
jan 1, 2002
40.296
+1.433
3.69%
jan 1, 2003
40.844
+0.548
1.36%
jan 1, 2004
40.551
-0.293
-0.72%
jan 1, 2005
40.504
-0.047
-0.12%
jan 1, 2006
41.103
+0.599
1.48%
jan 1, 2007
41.819
+0.716
1.74%
jan 1, 2008
42.031
+0.212
0.51%
jan 1, 2009
42.515
+0.484
1.15%
jan 1, 2010
45.766
+3.25
7.65%
jan 1, 2011
44.541
-1.224
-2.68%
jan 1, 2012
45.527
+0.986
2.21%
jan 1, 2013
46.299
+0.772
1.7%
jan 1, 2014
46.616
+0.317
0.68%
jan 1, 2015
47.36
+0.744
1.6%
jan 1, 2016
48.607
+1.247
2.63%
Ranking of countries by current statistics by years


Comments: