29
/
en
AIzaSyAYiBZKx7MnpbEhh9jyipgxe19OcubqV5w
April 1, 2024
240285
Singapore
SGP
true
2
1
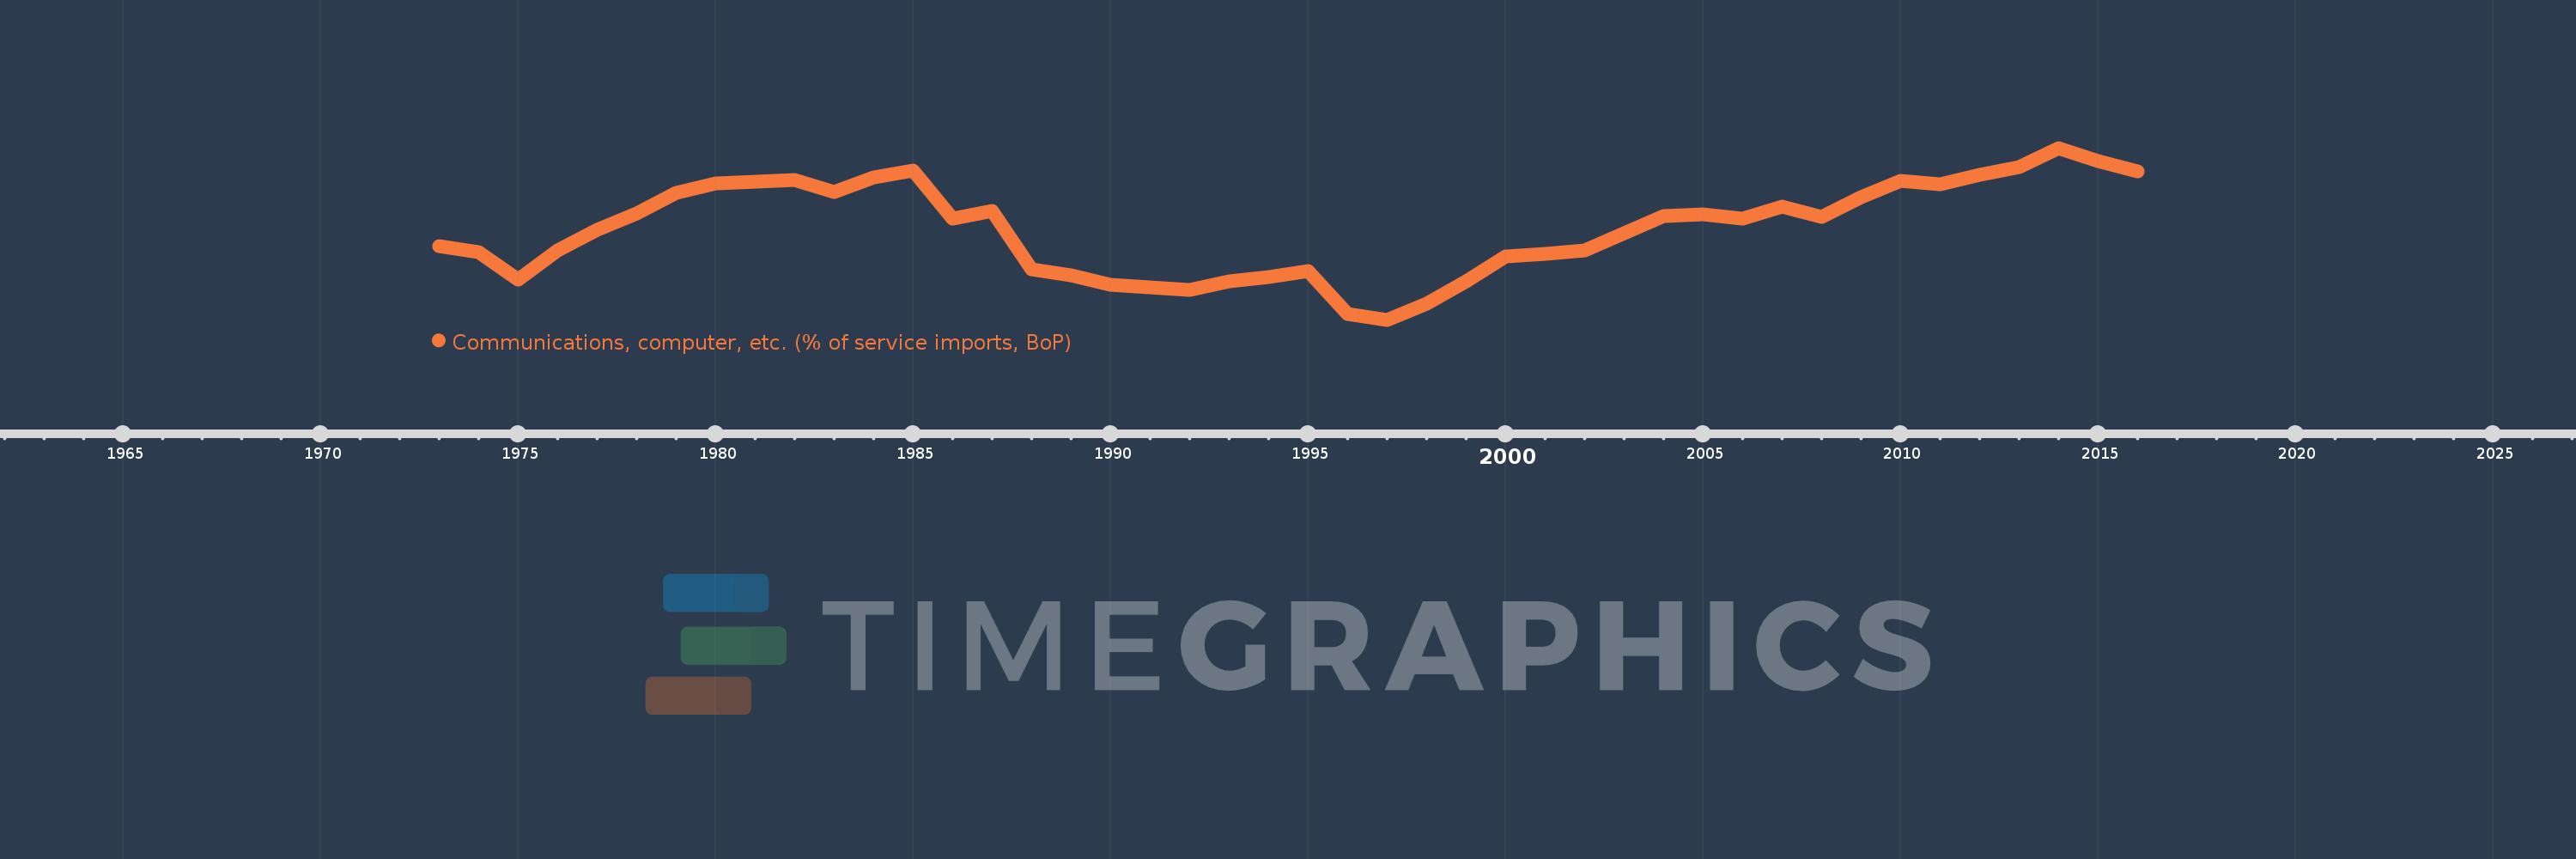
Communications, computer, etc. (% of service imports, BoP)
2016,2015,2014,2013,2012,2011,2010,2009,2008,2007,2006,2005,2004,2003,2002,2001,2000,1999,1998,1997,1996,1995,1994,1993,1992,1991,1990,1989,1988,1987,1986,1985,1984,1983,1982,1981,1980,1979,1978,1977,1976,1975,1974,1973
This statistics in other country:
AfghanistanAlbaniaAlgeriaAngolaAntigua and BarbudaArab WorldArgentinaArmeniaArubaAustraliaAustriaAzerbaijanBahamas, TheBahrainBangladeshBarbadosBelarusBelgiumBelizeBeninBermudaBhutanBoliviaBosnia and HerzegovinaBotswanaBrazilBrunei DarussalamBulgariaBurkina FasoBurundiCabo VerdeCambodiaCameroonCanadaCaribbean small statesCentral African RepublicCentral Europe and the BalticsChadChileChinaColombiaComorosCongo, Dem. Rep.Congo, Rep.Costa RicaCote d'IvoireCroatiaCuracaoCyprusCzech RepublicDenmarkDjiboutiDominicaDominican RepublicEarly-demographic dividendEast Asia & PacificEast Asia & Pacific (excluding high income)East Asia & Pacific (IDA & IBRD countries)EcuadorEgypt, Arab Rep.El SalvadorEquatorial GuineaEritreaEstoniaEthiopiaEuro areaEurope & Central AsiaEurope & Central Asia (excluding high income)Europe & Central Asia (IDA & IBRD countries)European UnionFaroe IslandsFijiFinlandFragile and conflict affected situationsFranceFrench PolynesiaGabonGambia, TheGeorgiaGermanyGhanaGreeceGrenadaGuatemalaGuineaGuinea-BissauGuyanaHaitiHeavily indebted poor countries (HIPC)High incomeHondurasHong Kong SAR, ChinaHungaryIBRD onlyIcelandIDA & IBRD totalIDA onlyIDA totalIndiaIndonesiaIran, Islamic Rep.IraqIrelandIsraelItalyJamaicaJapanJordanKazakhstanKenyaKiribatiKorea, Rep.KosovoKuwaitKyrgyz RepublicLao PDRLate-demographic dividendLatin America & Caribbean Latin America & Caribbean (excluding high income)Latin America & the Caribbean (IDA & IBRD countries)LatviaLeast developed countries: UN classificationLebanonLesothoLiberiaLibyaLithuaniaLow & middle incomeLow incomeLower middle incomeLuxembourgMacao SAR, ChinaMacedonia, FYRMadagascarMalawiMalaysiaMaldivesMaliMaltaMarshall IslandsMauritaniaMauritiusMexicoMicronesia, Fed. Sts.Middle East & North AfricaMiddle East & North Africa (excluding high income)Middle East & North Africa (IDA & IBRD countries)Middle incomeMoldovaMongoliaMontenegroMoroccoMozambiqueMyanmarNamibiaNepalNetherlandsNew CaledoniaNew ZealandNicaraguaNigerNigeriaNorth AmericaNorwayOECD membersOmanOther small statesPacific island small statesPakistanPalauPanamaPapua New GuineaParaguayPeruPhilippinesPolandPortugalPost-demographic dividendPre-demographic dividendQatarRomaniaRussian FederationRwandaSamoaSao Tome and PrincipeSaudi ArabiaSenegalSerbiaSeychellesSierra LeoneSingaporeSint Maarten (Dutch part)Slovak RepublicSloveniaSmall statesSolomon IslandsSouth AfricaSouth AsiaSouth Asia (IDA & IBRD)South SudanSpainSri LankaSt. Kitts and NevisSt. LuciaSt. Vincent and the GrenadinesSub-Saharan Africa Sub-Saharan Africa (excluding high income)Sub-Saharan Africa (IDA & IBRD countries)SudanSurinameSwazilandSwedenSwitzerlandSyrian Arab RepublicTajikistanTanzaniaThailandTimor-LesteTogoTongaTrinidad and TobagoTunisiaTurkeyTuvaluUgandaUkraineUnited KingdomUnited StatesUpper middle incomeUruguayVanuatuVenezuela, RBWest Bank and GazaWorldYemen, Rep.ZambiaZimbabwe Timeline:
This timeline shows a graph from 1973 to 2016 of Singapore. No data until 1972. Number of actual observations by date: 44.
Source name:
World Development Indicators
Source organization:
International Monetary Fund, Balance of Payments Statistics Yearbook and data files.
Categories, topics:
Economy & Growth, Trade
Last updated:
apr 23, 2017
Indicators value changes by year
Minimum:
24.509
jan 1, 1997
Maximum:
51.257
jan 1, 2014
At the date of observation
Value
Absolute change
Change from previous value
jan 1, 1973
35.977
+35.977
0.0%
jan 1, 1974
35.031
-0.945
-2.63%
jan 1, 1975
30.811
-4.22
-12.05%
jan 1, 1976
35.312
+4.501
14.61%
jan 1, 1977
38.503
+3.191
9.04%
jan 1, 1978
41.014
+2.511
6.52%
jan 1, 1979
44.217
+3.203
7.81%
jan 1, 1980
45.671
+1.454
3.29%
jan 1, 1981
46.063
+0.392
0.86%
jan 1, 1982
46.261
+0.199
0.43%
jan 1, 1983
44.354
-1.907
-4.12%
jan 1, 1984
46.622
+2.268
5.11%
jan 1, 1985
47.746
+1.124
2.41%
jan 1, 1986
40.307
-7.439
-15.58%
jan 1, 1987
41.491
+1.184
2.94%
jan 1, 1988
32.388
-9.102
-21.94%
jan 1, 1989
31.388
-1.001
-3.09%
jan 1, 1990
29.977
-1.411
-4.49%
jan 1, 1991
29.504
-0.473
-1.58%
jan 1, 1992
29.093
-0.411
-1.39%
jan 1, 1993
30.485
+1.392
4.78%
jan 1, 1994
31.172
+0.688
2.26%
jan 1, 1995
32.104
+0.932
2.99%
jan 1, 1996
25.444
-6.66
-20.75%
jan 1, 1997
24.509
-0.934
-3.67%
jan 1, 1998
27.006
+2.496
10.19%
jan 1, 1999
30.497
+3.491
12.93%
jan 1, 2000
34.427
+3.93
12.89%
jan 1, 2001
34.808
+0.381
1.11%
jan 1, 2002
35.262
+0.455
1.31%
jan 1, 2003
37.941
+2.679
7.6%
jan 1, 2004
40.644
+2.703
7.12%
jan 1, 2005
40.936
+0.292
0.72%
jan 1, 2006
40.237
-0.699
-1.71%
jan 1, 2007
42.131
+1.894
4.71%
jan 1, 2008
40.494
-1.637
-3.89%
jan 1, 2009
43.552
+3.058
7.55%
jan 1, 2010
46.109
+2.557
5.87%
jan 1, 2011
45.584
-0.525
-1.14%
jan 1, 2012
47.097
+1.514
3.32%
jan 1, 2013
48.316
+1.219
2.59%
jan 1, 2014
51.257
+2.941
6.09%
jan 1, 2015
49.256
-2.001
-3.9%
jan 1, 2016
47.638
-1.619
-3.29%
Ranking of countries by current statistics by years


Comments: