29
/
en
AIzaSyAYiBZKx7MnpbEhh9jyipgxe19OcubqV5w
April 1, 2024
50734
Middle income
MIC
false
2
1
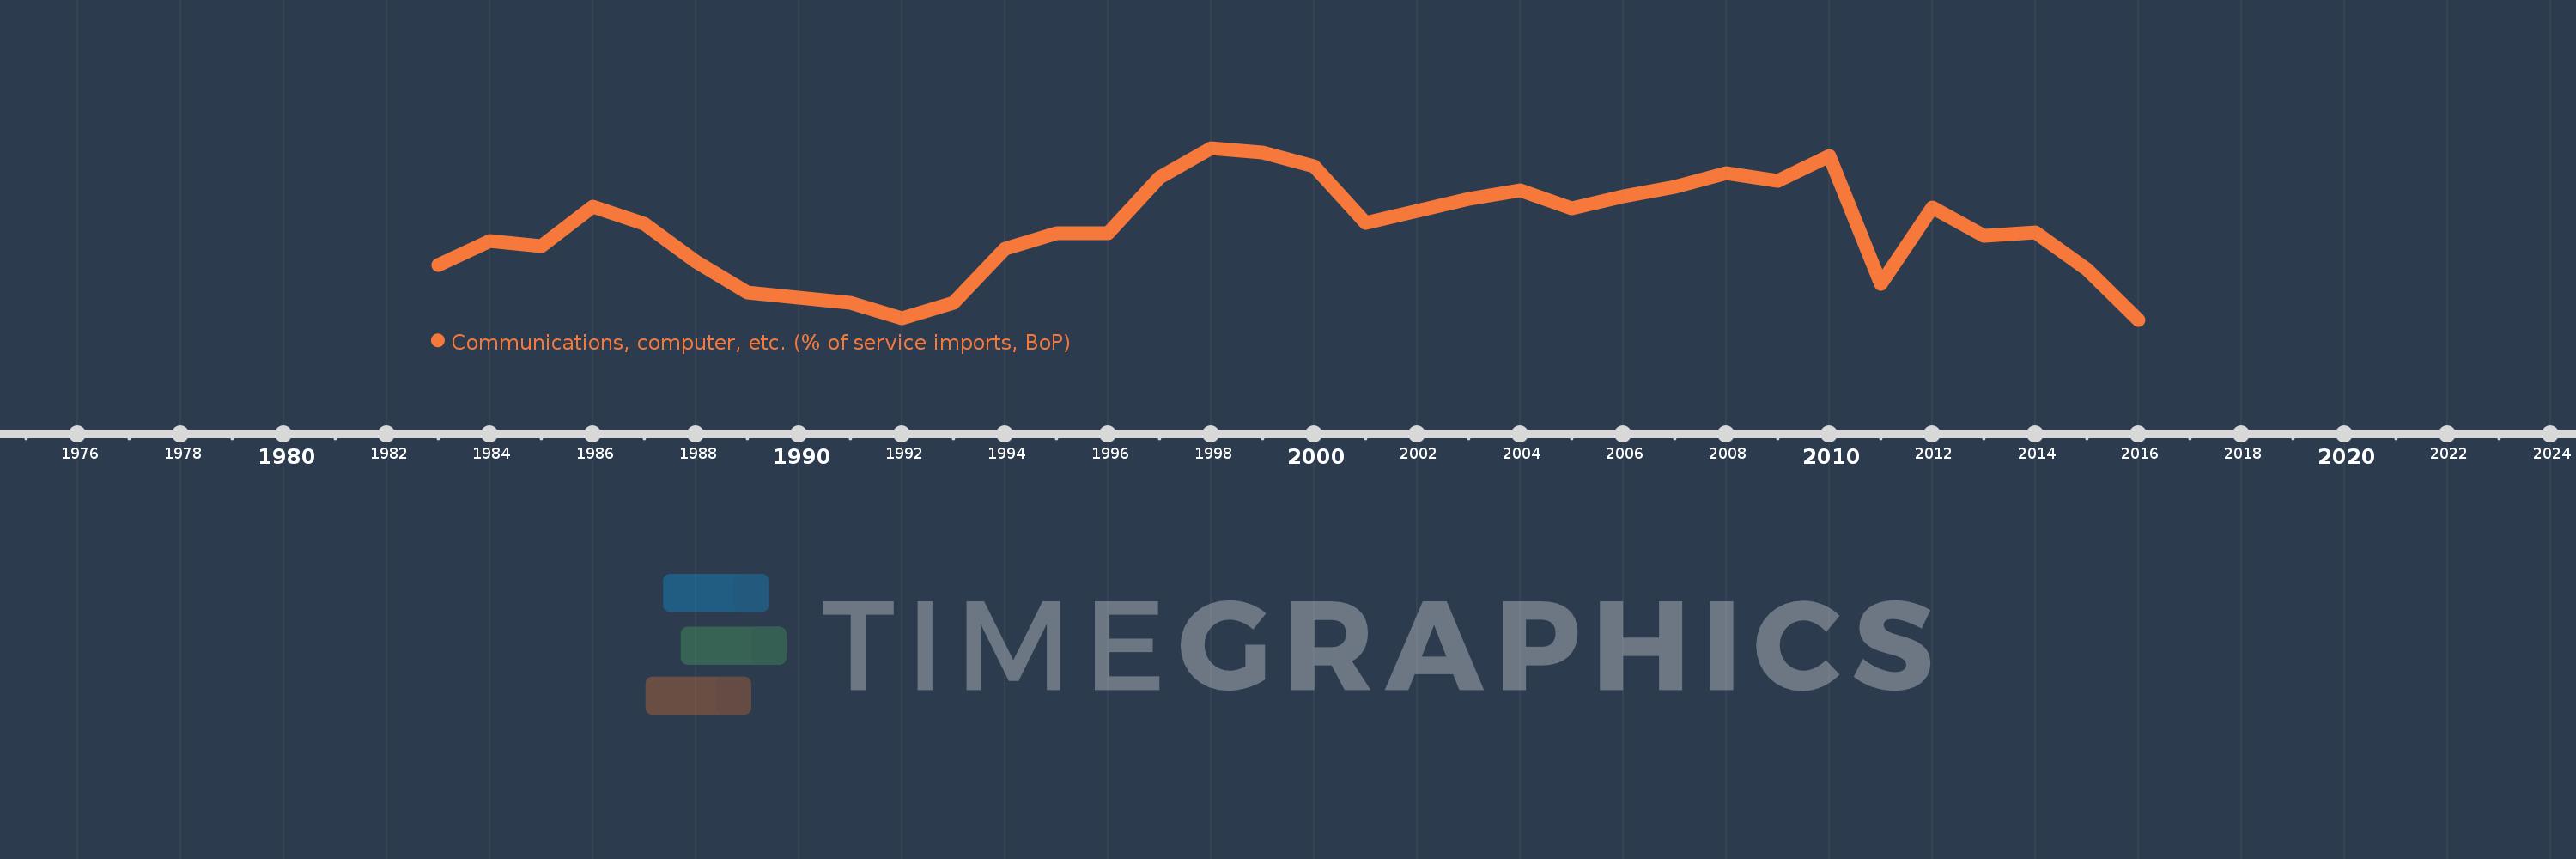
Communications, computer, etc. (% of service imports, BoP)
2016,2015,2014,2013,2012,2011,2010,2009,2008,2007,2006,2005,2004,2003,2002,2001,2000,1999,1998,1997,1996,1995,1994,1993,1992,1991,1990,1989,1988,1987,1986,1985,1984,1983
This statistics in other country:
AfghanistanAlbaniaAlgeriaAngolaAntigua and BarbudaArab WorldArgentinaArmeniaArubaAustraliaAustriaAzerbaijanBahamas, TheBahrainBangladeshBarbadosBelarusBelgiumBelizeBeninBermudaBhutanBoliviaBosnia and HerzegovinaBotswanaBrazilBrunei DarussalamBulgariaBurkina FasoBurundiCabo VerdeCambodiaCameroonCanadaCaribbean small statesCentral African RepublicCentral Europe and the BalticsChadChileChinaColombiaComorosCongo, Dem. Rep.Congo, Rep.Costa RicaCote d'IvoireCroatiaCuracaoCyprusCzech RepublicDenmarkDjiboutiDominicaDominican RepublicEarly-demographic dividendEast Asia & PacificEast Asia & Pacific (excluding high income)East Asia & Pacific (IDA & IBRD countries)EcuadorEgypt, Arab Rep.El SalvadorEquatorial GuineaEritreaEstoniaEthiopiaEuro areaEurope & Central AsiaEurope & Central Asia (excluding high income)Europe & Central Asia (IDA & IBRD countries)European UnionFaroe IslandsFijiFinlandFragile and conflict affected situationsFranceFrench PolynesiaGabonGambia, TheGeorgiaGermanyGhanaGreeceGrenadaGuatemalaGuineaGuinea-BissauGuyanaHaitiHeavily indebted poor countries (HIPC)High incomeHondurasHong Kong SAR, ChinaHungaryIBRD onlyIcelandIDA & IBRD totalIDA onlyIDA totalIndiaIndonesiaIran, Islamic Rep.IraqIrelandIsraelItalyJamaicaJapanJordanKazakhstanKenyaKiribatiKorea, Rep.KosovoKuwaitKyrgyz RepublicLao PDRLate-demographic dividendLatin America & Caribbean Latin America & Caribbean (excluding high income)Latin America & the Caribbean (IDA & IBRD countries)LatviaLeast developed countries: UN classificationLebanonLesothoLiberiaLibyaLithuaniaLow & middle incomeLow incomeLower middle incomeLuxembourgMacao SAR, ChinaMacedonia, FYRMadagascarMalawiMalaysiaMaldivesMaliMaltaMarshall IslandsMauritaniaMauritiusMexicoMicronesia, Fed. Sts.Middle East & North AfricaMiddle East & North Africa (excluding high income)Middle East & North Africa (IDA & IBRD countries)Middle incomeMoldovaMongoliaMontenegroMoroccoMozambiqueMyanmarNamibiaNepalNetherlandsNew CaledoniaNew ZealandNicaraguaNigerNigeriaNorth AmericaNorwayOECD membersOmanOther small statesPacific island small statesPakistanPalauPanamaPapua New GuineaParaguayPeruPhilippinesPolandPortugalPost-demographic dividendPre-demographic dividendQatarRomaniaRussian FederationRwandaSamoaSao Tome and PrincipeSaudi ArabiaSenegalSerbiaSeychellesSierra LeoneSingaporeSint Maarten (Dutch part)Slovak RepublicSloveniaSmall statesSolomon IslandsSouth AfricaSouth AsiaSouth Asia (IDA & IBRD)South SudanSpainSri LankaSt. Kitts and NevisSt. LuciaSt. Vincent and the GrenadinesSub-Saharan Africa Sub-Saharan Africa (excluding high income)Sub-Saharan Africa (IDA & IBRD countries)SudanSurinameSwazilandSwedenSwitzerlandSyrian Arab RepublicTajikistanTanzaniaThailandTimor-LesteTogoTongaTrinidad and TobagoTunisiaTurkeyTuvaluUgandaUkraineUnited KingdomUnited StatesUpper middle incomeUruguayVanuatuVenezuela, RBWest Bank and GazaWorldYemen, Rep.ZambiaZimbabwe Timeline:
This timeline shows a graph from 1983 to 2016 of Middle income. No data until 1982. Number of actual observations by date: 34.
Source name:
World Development Indicators
Source organization:
International Monetary Fund, Balance of Payments Statistics Yearbook and data files.
Categories, topics:
Economy & Growth, Trade
Last updated:
apr 23, 2017
Indicators value changes by year
Minimum:
29.336
jan 1, 2016
Maximum:
37.299
jan 1, 1998
At the date of observation
Value
Absolute change
Change from previous value
jan 1, 1983
31.857
+31.857
0.0%
jan 1, 1984
33.006
+1.149
3.61%
jan 1, 1985
32.752
-0.254
-0.77%
jan 1, 1986
34.586
+1.834
5.6%
jan 1, 1987
33.798
-0.788
-2.28%
jan 1, 1988
32.023
-1.774
-5.25%
jan 1, 1989
30.609
-1.415
-4.42%
jan 1, 1990
30.355
-0.253
-0.83%
jan 1, 1991
30.113
-0.243
-0.8%
jan 1, 1992
29.422
-0.691
-2.3%
jan 1, 1993
30.138
+0.717
2.44%
jan 1, 1994
32.644
+2.505
8.31%
jan 1, 1995
33.363
+0.72
2.2%
jan 1, 1996
33.33
-0.034
-0.1%
jan 1, 1997
35.935
+2.606
7.82%
jan 1, 1998
37.299
+1.364
3.8%
jan 1, 1999
37.083
-0.216
-0.58%
jan 1, 2000
36.455
-0.629
-1.69%
jan 1, 2001
33.821
-2.634
-7.23%
jan 1, 2002
34.379
+0.558
1.65%
jan 1, 2003
34.941
+0.562
1.64%
jan 1, 2004
35.336
+0.395
1.13%
jan 1, 2005
34.506
-0.829
-2.35%
jan 1, 2006
35.069
+0.563
1.63%
jan 1, 2007
35.486
+0.417
1.19%
jan 1, 2008
36.144
+0.658
1.86%
jan 1, 2009
35.78
-0.364
-1.01%
jan 1, 2010
36.943
+1.163
3.25%
jan 1, 2011
31.011
-5.932
-16.06%
jan 1, 2012
34.555
+3.544
11.43%
jan 1, 2013
33.242
-1.313
-3.8%
jan 1, 2014
33.382
+0.14
0.42%
jan 1, 2015
31.674
-1.708
-5.12%
jan 1, 2016
29.336
-2.338
-7.38%
Ranking of countries by current statistics by years


Comments: