29
/
en
AIzaSyAYiBZKx7MnpbEhh9jyipgxe19OcubqV5w
April 1, 2024
160306
Israel
ISR
true
2
1
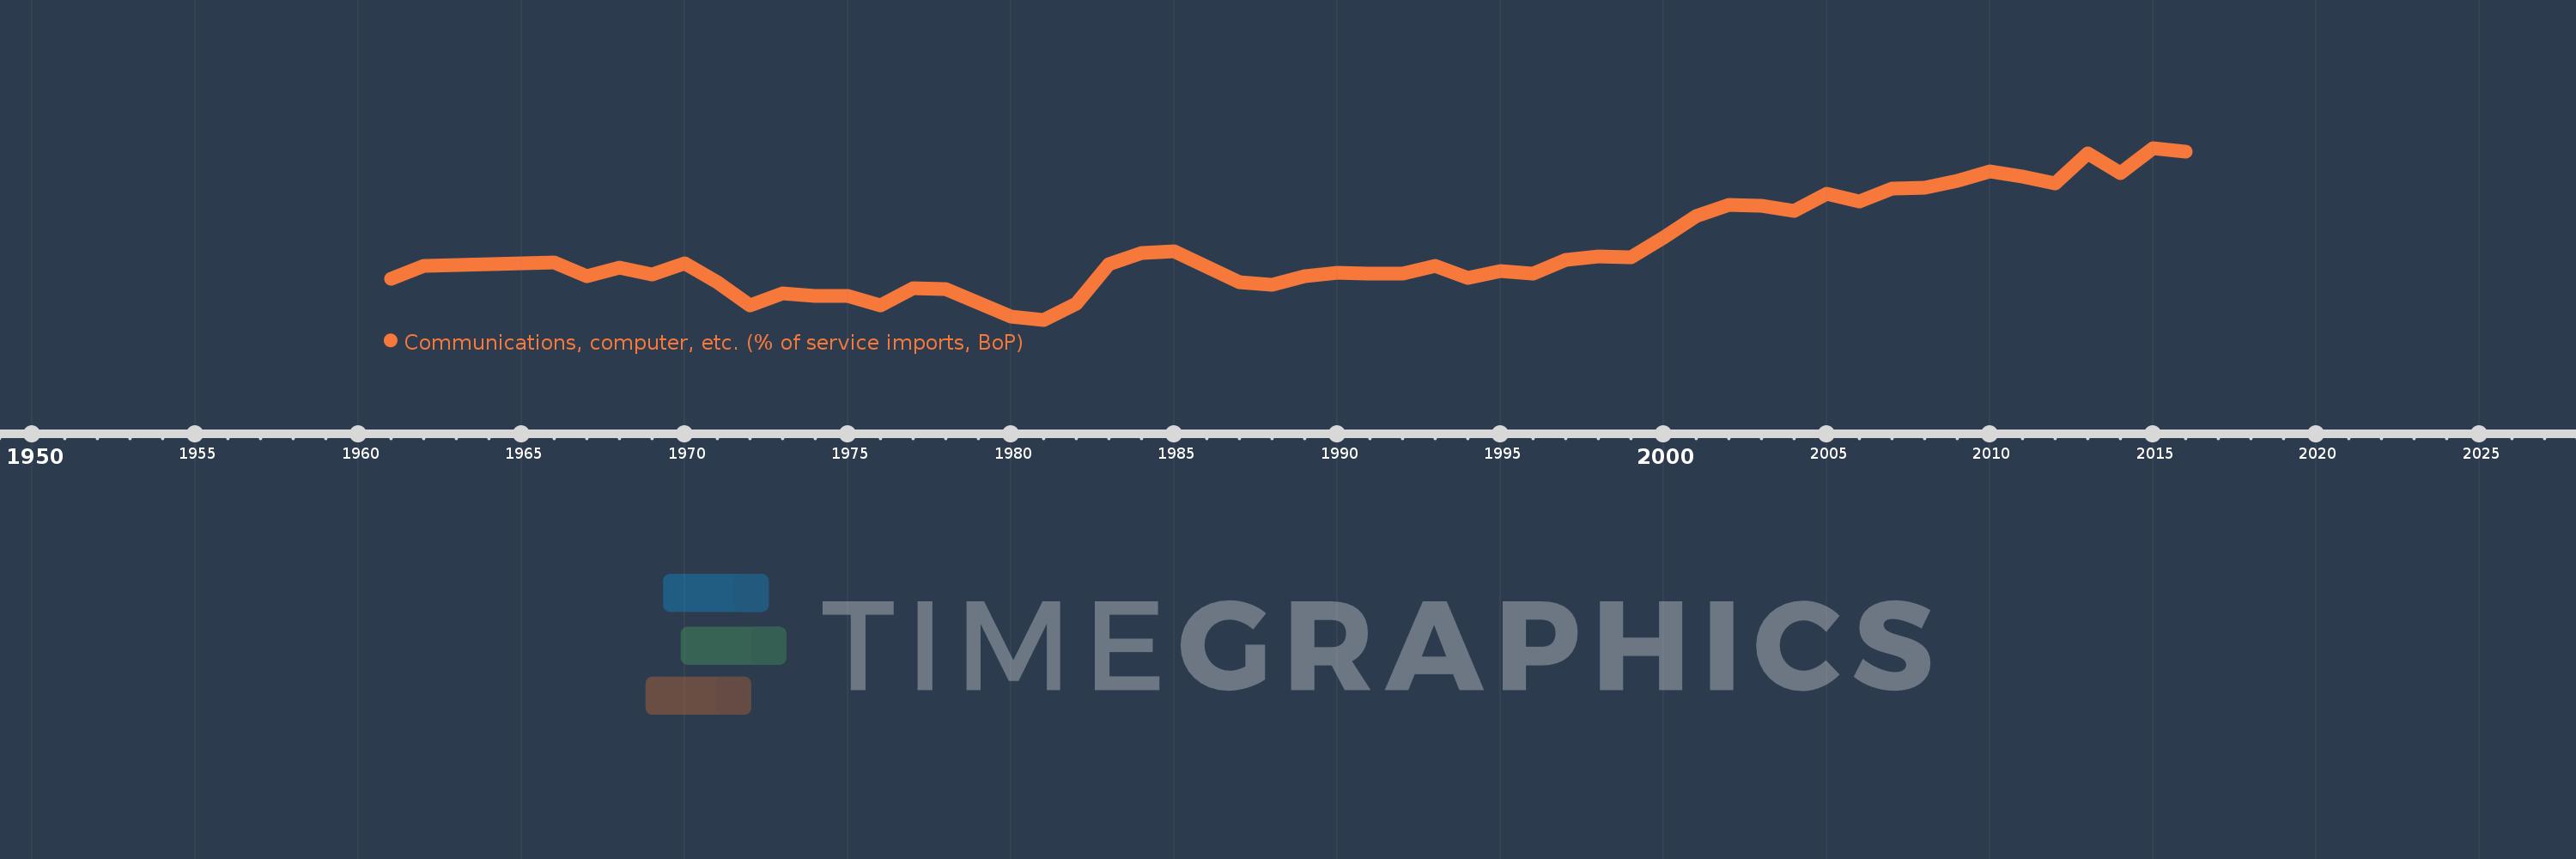
Communications, computer, etc. (% of service imports, BoP)
2016,2015,2014,2013,2012,2011,2010,2009,2008,2007,2006,2005,2004,2003,2002,2001,2000,1999,1998,1997,1996,1995,1994,1993,1992,1991,1990,1989,1988,1987,1986,1985,1984,1983,1982,1981,1980,1979,1978,1977,1976,1975,1974,1973,1972,1971,1970,1969,1968,1967,1966,1962,1961
This statistics in other country:
AfghanistanAlbaniaAlgeriaAngolaAntigua and BarbudaArab WorldArgentinaArmeniaArubaAustraliaAustriaAzerbaijanBahamas, TheBahrainBangladeshBarbadosBelarusBelgiumBelizeBeninBermudaBhutanBoliviaBosnia and HerzegovinaBotswanaBrazilBrunei DarussalamBulgariaBurkina FasoBurundiCabo VerdeCambodiaCameroonCanadaCaribbean small statesCentral African RepublicCentral Europe and the BalticsChadChileChinaColombiaComorosCongo, Dem. Rep.Congo, Rep.Costa RicaCote d'IvoireCroatiaCuracaoCyprusCzech RepublicDenmarkDjiboutiDominicaDominican RepublicEarly-demographic dividendEast Asia & PacificEast Asia & Pacific (excluding high income)East Asia & Pacific (IDA & IBRD countries)EcuadorEgypt, Arab Rep.El SalvadorEquatorial GuineaEritreaEstoniaEthiopiaEuro areaEurope & Central AsiaEurope & Central Asia (excluding high income)Europe & Central Asia (IDA & IBRD countries)European UnionFaroe IslandsFijiFinlandFragile and conflict affected situationsFranceFrench PolynesiaGabonGambia, TheGeorgiaGermanyGhanaGreeceGrenadaGuatemalaGuineaGuinea-BissauGuyanaHaitiHeavily indebted poor countries (HIPC)High incomeHondurasHong Kong SAR, ChinaHungaryIBRD onlyIcelandIDA & IBRD totalIDA onlyIDA totalIndiaIndonesiaIran, Islamic Rep.IraqIrelandIsraelItalyJamaicaJapanJordanKazakhstanKenyaKiribatiKorea, Rep.KosovoKuwaitKyrgyz RepublicLao PDRLate-demographic dividendLatin America & Caribbean Latin America & Caribbean (excluding high income)Latin America & the Caribbean (IDA & IBRD countries)LatviaLeast developed countries: UN classificationLebanonLesothoLiberiaLibyaLithuaniaLow & middle incomeLow incomeLower middle incomeLuxembourgMacao SAR, ChinaMacedonia, FYRMadagascarMalawiMalaysiaMaldivesMaliMaltaMarshall IslandsMauritaniaMauritiusMexicoMicronesia, Fed. Sts.Middle East & North AfricaMiddle East & North Africa (excluding high income)Middle East & North Africa (IDA & IBRD countries)Middle incomeMoldovaMongoliaMontenegroMoroccoMozambiqueMyanmarNamibiaNepalNetherlandsNew CaledoniaNew ZealandNicaraguaNigerNigeriaNorth AmericaNorwayOECD membersOmanOther small statesPacific island small statesPakistanPalauPanamaPapua New GuineaParaguayPeruPhilippinesPolandPortugalPost-demographic dividendPre-demographic dividendQatarRomaniaRussian FederationRwandaSamoaSao Tome and PrincipeSaudi ArabiaSenegalSerbiaSeychellesSierra LeoneSingaporeSint Maarten (Dutch part)Slovak RepublicSloveniaSmall statesSolomon IslandsSouth AfricaSouth AsiaSouth Asia (IDA & IBRD)South SudanSpainSri LankaSt. Kitts and NevisSt. LuciaSt. Vincent and the GrenadinesSub-Saharan Africa Sub-Saharan Africa (excluding high income)Sub-Saharan Africa (IDA & IBRD countries)SudanSurinameSwazilandSwedenSwitzerlandSyrian Arab RepublicTajikistanTanzaniaThailandTimor-LesteTogoTongaTrinidad and TobagoTunisiaTurkeyTuvaluUgandaUkraineUnited KingdomUnited StatesUpper middle incomeUruguayVanuatuVenezuela, RBWest Bank and GazaWorldYemen, Rep.ZambiaZimbabwe Timeline:
This timeline shows a graph from 1961 to 2016 of Israel. No data until 1960. Number of actual observations by date: 53.
Source name:
World Development Indicators
Source organization:
International Monetary Fund, Balance of Payments Statistics Yearbook and data files.
Categories, topics:
Economy & Growth, Trade
Last updated:
apr 23, 2017
Indicators value changes by year
Minimum:
18.528
jan 1, 1981
Maximum:
52.565
jan 1, 2015
At the date of observation
Value
Absolute change
Change from previous value
jan 1, 1961
26.667
+26.667
0.0%
jan 1, 1962
29.139
+2.472
9.27%
jan 1, 1966
29.861
+0.722
2.48%
jan 1, 1967
27.213
-2.648
-8.87%
jan 1, 1968
28.824
+1.61
5.92%
jan 1, 1969
27.485
-1.338
-4.64%
jan 1, 1970
29.787
+2.302
8.37%
jan 1, 1971
26.049
-3.739
-12.55%
jan 1, 1972
21.361
-4.688
-18.0%
jan 1, 1973
23.817
+2.456
11.5%
jan 1, 1974
23.295
-0.522
-2.19%
jan 1, 1975
23.168
-0.127
-0.54%
jan 1, 1976
21.285
-1.883
-8.13%
jan 1, 1977
24.762
+3.476
16.33%
jan 1, 1978
24.642
-0.12
-0.48%
jan 1, 1979
21.934
-2.708
-10.99%
jan 1, 1980
19.128
-2.806
-12.79%
jan 1, 1981
18.528
-0.6
-3.14%
jan 1, 1982
21.782
+3.254
17.56%
jan 1, 1983
29.468
+7.686
35.29%
jan 1, 1984
31.777
+2.309
7.83%
jan 1, 1985
32.019
+0.242
0.76%
jan 1, 1986
28.977
-3.042
-9.5%
jan 1, 1987
25.942
-3.035
-10.47%
jan 1, 1988
25.505
-0.437
-1.68%
jan 1, 1989
27.085
+1.58
6.19%
jan 1, 1990
27.881
+0.796
2.94%
jan 1, 1991
27.689
-0.192
-0.69%
jan 1, 1992
27.746
+0.057
0.21%
jan 1, 1993
29.247
+1.501
5.41%
jan 1, 1994
26.862
-2.385
-8.15%
jan 1, 1995
28.187
+1.324
4.93%
jan 1, 1996
27.751
-0.435
-1.54%
jan 1, 1997
30.363
+2.611
9.41%
jan 1, 1998
31.063
+0.7
2.31%
jan 1, 1999
30.88
-0.183
-0.59%
jan 1, 2000
34.86
+3.98
12.89%
jan 1, 2001
38.987
+4.128
11.84%
jan 1, 2002
41.261
+2.274
5.83%
jan 1, 2003
41.122
-0.138
-0.34%
jan 1, 2004
40.053
-1.069
-2.6%
jan 1, 2005
43.442
+3.389
8.46%
jan 1, 2006
42.008
-1.434
-3.3%
jan 1, 2007
44.539
+2.532
6.03%
jan 1, 2008
44.768
+0.228
0.51%
jan 1, 2009
46.015
+1.247
2.79%
jan 1, 2010
47.995
+1.98
4.3%
jan 1, 2011
46.931
-1.064
-2.22%
jan 1, 2012
45.516
-1.415
-3.02%
jan 1, 2013
51.414
+5.898
12.96%
jan 1, 2014
47.587
-3.827
-7.44%
jan 1, 2015
52.565
+4.978
10.46%
jan 1, 2016
51.765
-0.8
-1.52%
Ranking of countries by current statistics by years


Comments: