29
/
en
AIzaSyAYiBZKx7MnpbEhh9jyipgxe19OcubqV5w
April 1, 2024
206530
Nepal
NPL
true
2
1
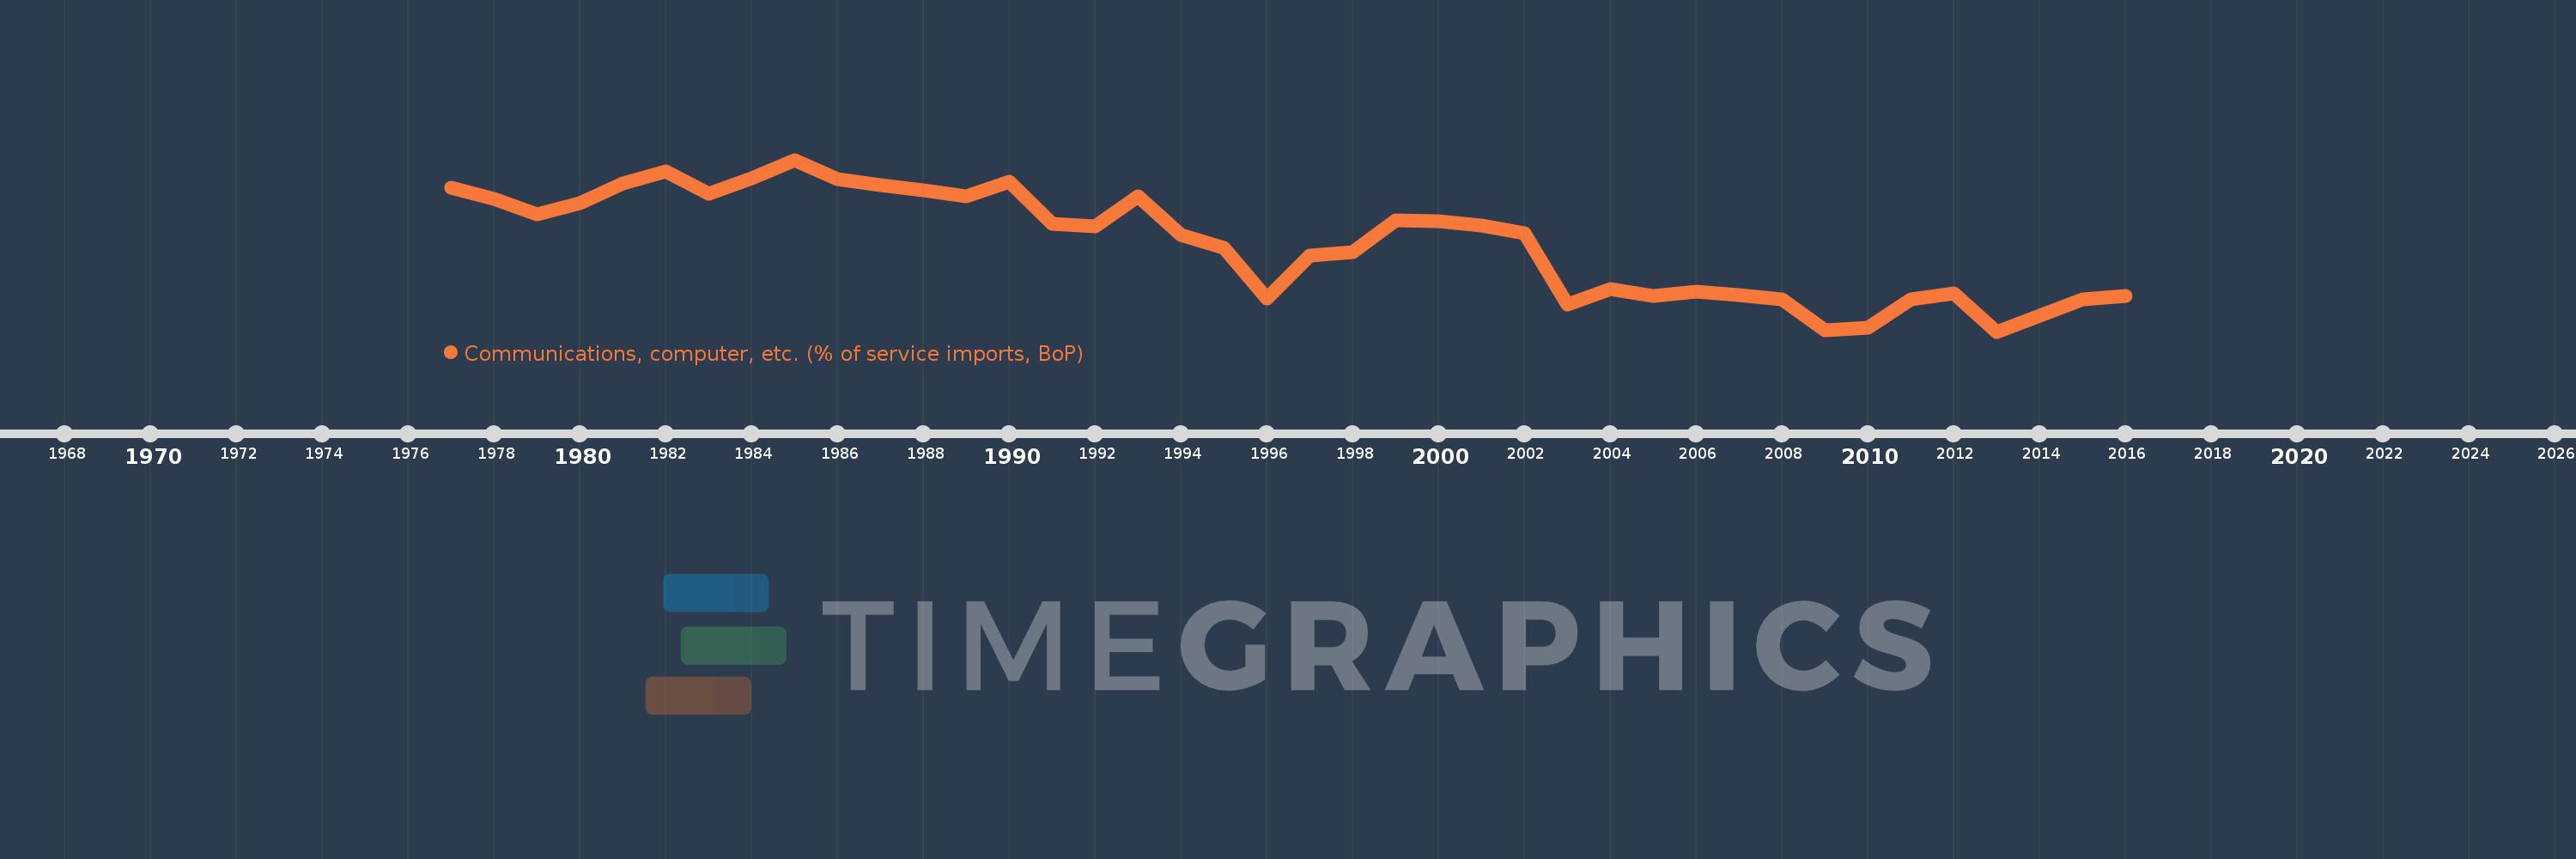
Communications, computer, etc. (% of service imports, BoP)
2016,2015,2014,2013,2012,2011,2010,2009,2008,2007,2006,2005,2004,2003,2002,2001,2000,1999,1998,1997,1996,1995,1994,1993,1992,1991,1990,1989,1988,1987,1986,1985,1984,1983,1982,1981,1980,1979,1978,1977
This statistics in other country:
AfghanistanAlbaniaAlgeriaAngolaAntigua and BarbudaArab WorldArgentinaArmeniaArubaAustraliaAustriaAzerbaijanBahamas, TheBahrainBangladeshBarbadosBelarusBelgiumBelizeBeninBermudaBhutanBoliviaBosnia and HerzegovinaBotswanaBrazilBrunei DarussalamBulgariaBurkina FasoBurundiCabo VerdeCambodiaCameroonCanadaCaribbean small statesCentral African RepublicCentral Europe and the BalticsChadChileChinaColombiaComorosCongo, Dem. Rep.Congo, Rep.Costa RicaCote d'IvoireCroatiaCuracaoCyprusCzech RepublicDenmarkDjiboutiDominicaDominican RepublicEarly-demographic dividendEast Asia & PacificEast Asia & Pacific (excluding high income)East Asia & Pacific (IDA & IBRD countries)EcuadorEgypt, Arab Rep.El SalvadorEquatorial GuineaEritreaEstoniaEthiopiaEuro areaEurope & Central AsiaEurope & Central Asia (excluding high income)Europe & Central Asia (IDA & IBRD countries)European UnionFaroe IslandsFijiFinlandFragile and conflict affected situationsFranceFrench PolynesiaGabonGambia, TheGeorgiaGermanyGhanaGreeceGrenadaGuatemalaGuineaGuinea-BissauGuyanaHaitiHeavily indebted poor countries (HIPC)High incomeHondurasHong Kong SAR, ChinaHungaryIBRD onlyIcelandIDA & IBRD totalIDA onlyIDA totalIndiaIndonesiaIran, Islamic Rep.IraqIrelandIsraelItalyJamaicaJapanJordanKazakhstanKenyaKiribatiKorea, Rep.KosovoKuwaitKyrgyz RepublicLao PDRLate-demographic dividendLatin America & Caribbean Latin America & Caribbean (excluding high income)Latin America & the Caribbean (IDA & IBRD countries)LatviaLeast developed countries: UN classificationLebanonLesothoLiberiaLibyaLithuaniaLow & middle incomeLow incomeLower middle incomeLuxembourgMacao SAR, ChinaMacedonia, FYRMadagascarMalawiMalaysiaMaldivesMaliMaltaMarshall IslandsMauritaniaMauritiusMexicoMicronesia, Fed. Sts.Middle East & North AfricaMiddle East & North Africa (excluding high income)Middle East & North Africa (IDA & IBRD countries)Middle incomeMoldovaMongoliaMontenegroMoroccoMozambiqueMyanmarNamibiaNepalNetherlandsNew CaledoniaNew ZealandNicaraguaNigerNigeriaNorth AmericaNorwayOECD membersOmanOther small statesPacific island small statesPakistanPalauPanamaPapua New GuineaParaguayPeruPhilippinesPolandPortugalPost-demographic dividendPre-demographic dividendQatarRomaniaRussian FederationRwandaSamoaSao Tome and PrincipeSaudi ArabiaSenegalSerbiaSeychellesSierra LeoneSingaporeSint Maarten (Dutch part)Slovak RepublicSloveniaSmall statesSolomon IslandsSouth AfricaSouth AsiaSouth Asia (IDA & IBRD)South SudanSpainSri LankaSt. Kitts and NevisSt. LuciaSt. Vincent and the GrenadinesSub-Saharan Africa Sub-Saharan Africa (excluding high income)Sub-Saharan Africa (IDA & IBRD countries)SudanSurinameSwazilandSwedenSwitzerlandSyrian Arab RepublicTajikistanTanzaniaThailandTimor-LesteTogoTongaTrinidad and TobagoTunisiaTurkeyTuvaluUgandaUkraineUnited KingdomUnited StatesUpper middle incomeUruguayVanuatuVenezuela, RBWest Bank and GazaWorldYemen, Rep.ZambiaZimbabwe Timeline:
This timeline shows a graph from 1977 to 2016 of Nepal. No data until 1976. Number of actual observations by date: 40.
Source name:
World Development Indicators
Source organization:
International Monetary Fund, Balance of Payments Statistics Yearbook and data files.
Categories, topics:
Economy & Growth, Trade
Last updated:
apr 23, 2017
Indicators value changes by year
Minimum:
12.454
jan 1, 2013
Maximum:
42.311
jan 1, 1985
At the date of observation
Value
Absolute change
Change from previous value
jan 1, 1977
37.46
+37.46
0.0%
jan 1, 1978
35.452
-2.007
-5.36%
jan 1, 1979
32.87
-2.583
-7.29%
jan 1, 1980
34.797
+1.928
5.86%
jan 1, 1981
38.218
+3.421
9.83%
jan 1, 1982
40.249
+2.031
5.31%
jan 1, 1983
36.412
-3.837
-9.53%
jan 1, 1984
39.111
+2.699
7.41%
jan 1, 1985
42.311
+3.2
8.18%
jan 1, 1986
39.011
-3.299
-7.8%
jan 1, 1987
37.972
-1.039
-2.66%
jan 1, 1988
37.045
-0.927
-2.44%
jan 1, 1989
35.972
-1.073
-2.9%
jan 1, 1990
38.505
+2.533
7.04%
jan 1, 1991
31.137
-7.368
-19.13%
jan 1, 1992
30.799
-0.338
-1.08%
jan 1, 1993
36.003
+5.204
16.9%
jan 1, 1994
29.231
-6.772
-18.81%
jan 1, 1995
27.031
-2.201
-7.53%
jan 1, 1996
18.218
-8.812
-32.6%
jan 1, 1997
25.665
+7.447
40.88%
jan 1, 1998
26.268
+0.603
2.35%
jan 1, 1999
31.805
+5.537
21.08%
jan 1, 2000
31.674
-0.132
-0.41%
jan 1, 2001
30.943
-0.73
-2.31%
jan 1, 2002
29.5
-1.443
-4.66%
jan 1, 2003
17.083
-12.417
-42.09%
jan 1, 2004
19.812
+2.729
15.98%
jan 1, 2005
18.58
-1.232
-6.22%
jan 1, 2006
19.408
+0.827
4.45%
jan 1, 2007
18.773
-0.634
-3.27%
jan 1, 2008
18.117
-0.656
-3.5%
jan 1, 2009
12.749
-5.368
-29.63%
jan 1, 2010
13.062
+0.313
2.46%
jan 1, 2011
18.067
+5.004
38.31%
jan 1, 2012
19.074
+1.008
5.58%
jan 1, 2013
12.454
-6.62
-34.71%
jan 1, 2014
15.284
+2.831
22.73%
jan 1, 2015
18.094
+2.81
18.38%
jan 1, 2016
18.678
+0.584
3.23%
Ranking of countries by current statistics by years


Comments: