29
/
en
AIzaSyAYiBZKx7MnpbEhh9jyipgxe19OcubqV5w
April 1, 2024
266660
Trinidad and Tobago
TTO
true
2
1
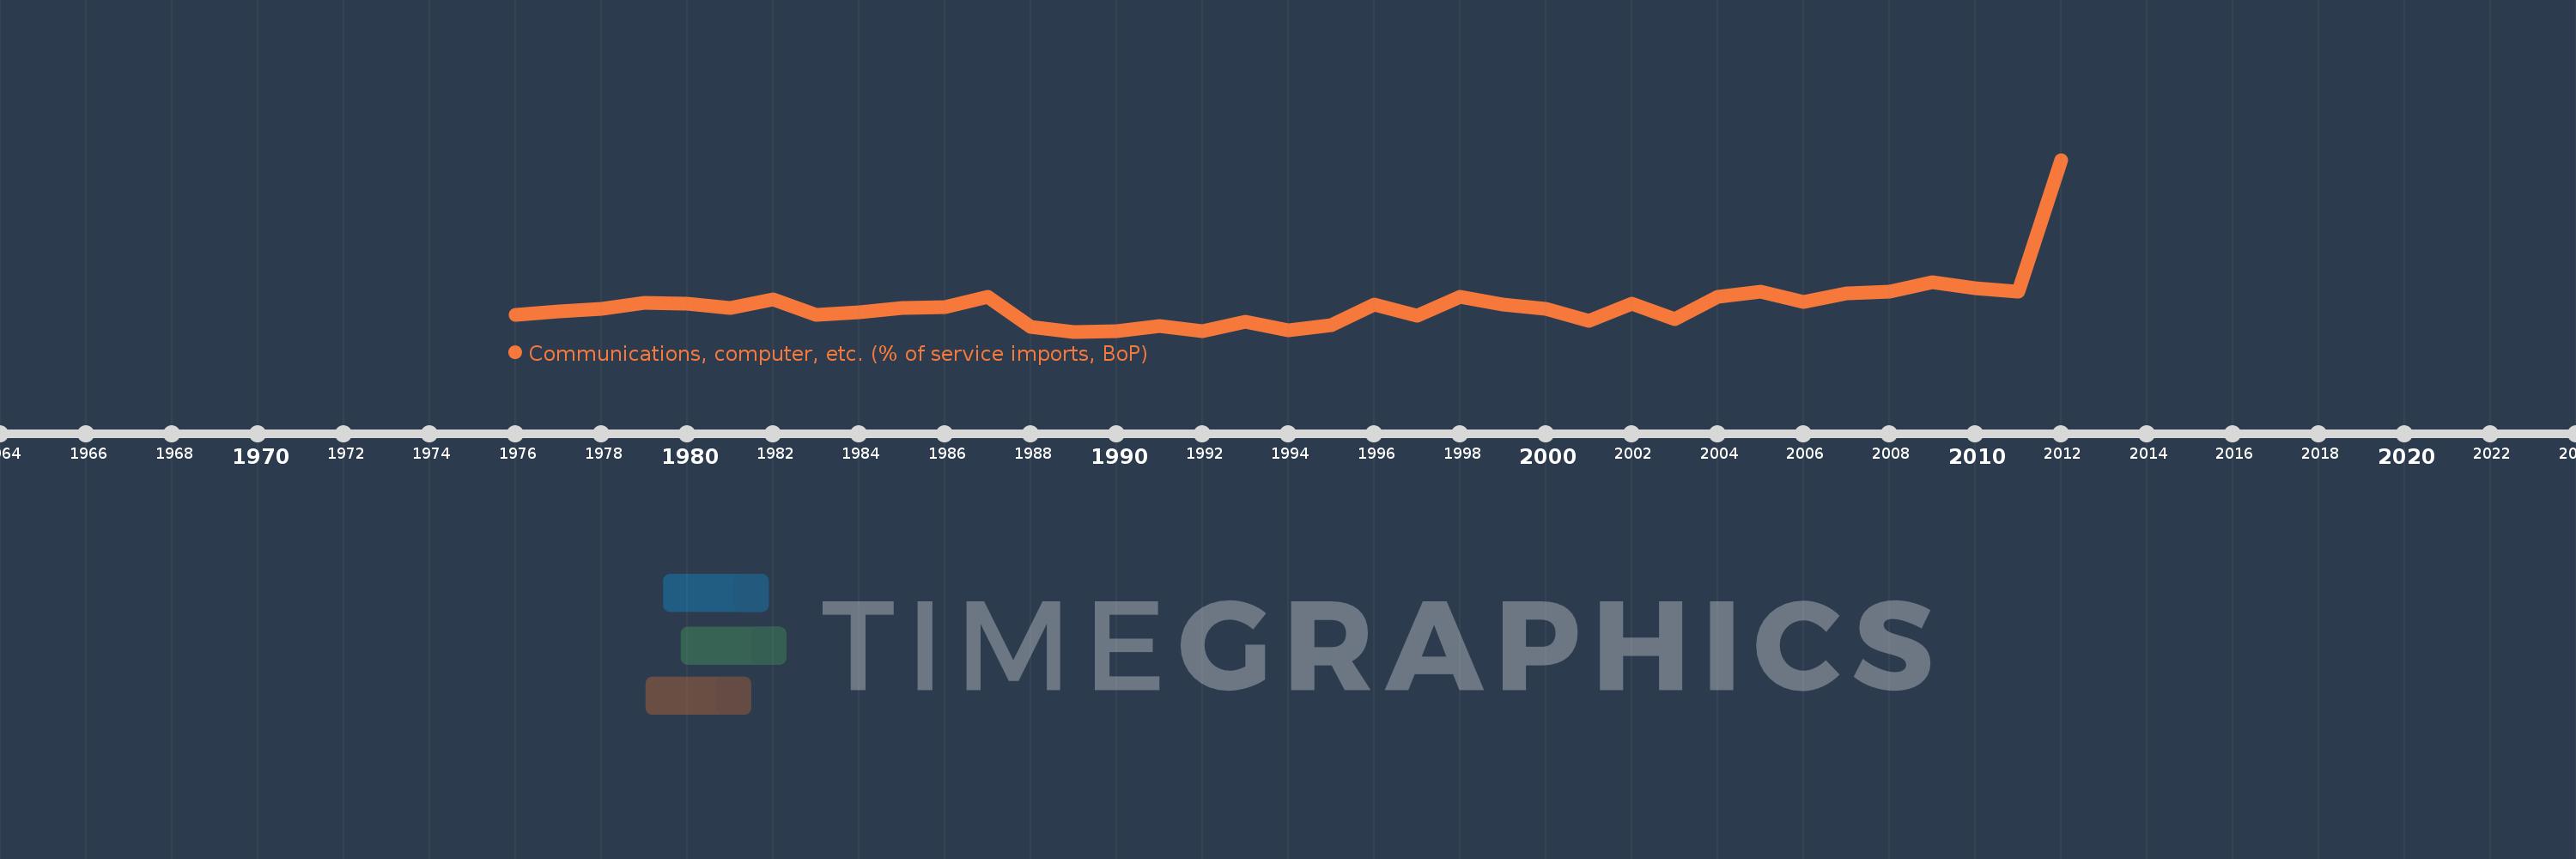
Communications, computer, etc. (% of service imports, BoP)
2012,2011,2010,2009,2008,2007,2006,2005,2004,2003,2002,2001,2000,1999,1998,1997,1996,1995,1994,1993,1992,1991,1990,1989,1988,1987,1986,1985,1984,1983,1982,1981,1980,1979,1978,1977,1976
This statistics in other country:
AfghanistanAlbaniaAlgeriaAngolaAntigua and BarbudaArab WorldArgentinaArmeniaArubaAustraliaAustriaAzerbaijanBahamas, TheBahrainBangladeshBarbadosBelarusBelgiumBelizeBeninBermudaBhutanBoliviaBosnia and HerzegovinaBotswanaBrazilBrunei DarussalamBulgariaBurkina FasoBurundiCabo VerdeCambodiaCameroonCanadaCaribbean small statesCentral African RepublicCentral Europe and the BalticsChadChileChinaColombiaComorosCongo, Dem. Rep.Congo, Rep.Costa RicaCote d'IvoireCroatiaCuracaoCyprusCzech RepublicDenmarkDjiboutiDominicaDominican RepublicEarly-demographic dividendEast Asia & PacificEast Asia & Pacific (excluding high income)East Asia & Pacific (IDA & IBRD countries)EcuadorEgypt, Arab Rep.El SalvadorEquatorial GuineaEritreaEstoniaEthiopiaEuro areaEurope & Central AsiaEurope & Central Asia (excluding high income)Europe & Central Asia (IDA & IBRD countries)European UnionFaroe IslandsFijiFinlandFragile and conflict affected situationsFranceFrench PolynesiaGabonGambia, TheGeorgiaGermanyGhanaGreeceGrenadaGuatemalaGuineaGuinea-BissauGuyanaHaitiHeavily indebted poor countries (HIPC)High incomeHondurasHong Kong SAR, ChinaHungaryIBRD onlyIcelandIDA & IBRD totalIDA onlyIDA totalIndiaIndonesiaIran, Islamic Rep.IraqIrelandIsraelItalyJamaicaJapanJordanKazakhstanKenyaKiribatiKorea, Rep.KosovoKuwaitKyrgyz RepublicLao PDRLate-demographic dividendLatin America & Caribbean Latin America & Caribbean (excluding high income)Latin America & the Caribbean (IDA & IBRD countries)LatviaLeast developed countries: UN classificationLebanonLesothoLiberiaLibyaLithuaniaLow & middle incomeLow incomeLower middle incomeLuxembourgMacao SAR, ChinaMacedonia, FYRMadagascarMalawiMalaysiaMaldivesMaliMaltaMarshall IslandsMauritaniaMauritiusMexicoMicronesia, Fed. Sts.Middle East & North AfricaMiddle East & North Africa (excluding high income)Middle East & North Africa (IDA & IBRD countries)Middle incomeMoldovaMongoliaMontenegroMoroccoMozambiqueMyanmarNamibiaNepalNetherlandsNew CaledoniaNew ZealandNicaraguaNigerNigeriaNorth AmericaNorwayOECD membersOmanOther small statesPacific island small statesPakistanPalauPanamaPapua New GuineaParaguayPeruPhilippinesPolandPortugalPost-demographic dividendPre-demographic dividendQatarRomaniaRussian FederationRwandaSamoaSao Tome and PrincipeSaudi ArabiaSenegalSerbiaSeychellesSierra LeoneSingaporeSint Maarten (Dutch part)Slovak RepublicSloveniaSmall statesSolomon IslandsSouth AfricaSouth AsiaSouth Asia (IDA & IBRD)South SudanSpainSri LankaSt. Kitts and NevisSt. LuciaSt. Vincent and the GrenadinesSub-Saharan Africa Sub-Saharan Africa (excluding high income)Sub-Saharan Africa (IDA & IBRD countries)SudanSurinameSwazilandSwedenSwitzerlandSyrian Arab RepublicTajikistanTanzaniaThailandTimor-LesteTogoTongaTrinidad and TobagoTunisiaTurkeyTuvaluUgandaUkraineUnited KingdomUnited StatesUpper middle incomeUruguayVanuatuVenezuela, RBWest Bank and GazaWorldYemen, Rep.ZambiaZimbabwe Timeline:
This timeline shows a graph from 1976 to 2012 of Trinidad and Tobago. No data until 1975. Number of actual observations by date: 37.
Source name:
World Development Indicators
Source organization:
International Monetary Fund, Balance of Payments Statistics Yearbook and data files.
Categories, topics:
Economy & Growth, Trade
Last updated:
apr 23, 2017
Indicators value changes by year
Minimum:
12.918
jan 1, 1989
Maximum:
89.755
jan 1, 2012
At the date of observation
Value
Absolute change
Change from previous value
jan 1, 1976
20.252
+20.252
0.0%
jan 1, 1977
22.079
+1.827
9.02%
jan 1, 1978
23.127
+1.048
4.75%
jan 1, 1979
25.765
+2.638
11.41%
jan 1, 1980
25.413
-0.352
-1.37%
jan 1, 1981
23.45
-1.963
-7.72%
jan 1, 1982
27.275
+3.824
16.31%
jan 1, 1983
20.295
-6.98
-25.59%
jan 1, 1984
21.711
+1.417
6.98%
jan 1, 1985
23.624
+1.913
8.81%
jan 1, 1986
23.979
+0.355
1.5%
jan 1, 1987
28.299
+4.32
18.02%
jan 1, 1988
15.18
-13.119
-46.36%
jan 1, 1989
12.918
-2.261
-14.9%
jan 1, 1990
13.173
+0.254
1.97%
jan 1, 1991
15.365
+2.193
16.64%
jan 1, 1992
13.164
-2.201
-14.32%
jan 1, 1993
17.517
+4.353
33.07%
jan 1, 1994
13.459
-4.058
-23.17%
jan 1, 1995
15.883
+2.424
18.01%
jan 1, 1996
25.078
+9.195
57.89%
jan 1, 1997
20.047
-5.031
-20.06%
jan 1, 1998
28.414
+8.367
41.73%
jan 1, 1999
25.151
-3.263
-11.48%
jan 1, 2000
23.248
-1.903
-7.56%
jan 1, 2001
17.529
-5.719
-24.6%
jan 1, 2002
25.486
+7.958
45.4%
jan 1, 2003
18.525
-6.961
-27.31%
jan 1, 2004
28.354
+9.829
53.06%
jan 1, 2005
30.705
+2.351
8.29%
jan 1, 2006
26.203
-4.503
-14.66%
jan 1, 2007
30.099
+3.897
14.87%
jan 1, 2008
30.773
+0.674
2.24%
jan 1, 2009
35.184
+4.411
14.33%
jan 1, 2010
32.22
-2.964
-8.42%
jan 1, 2011
30.866
-1.354
-4.2%
jan 1, 2012
89.755
+58.889
190.79%
Ranking of countries by current statistics by years


Comments: