29
/
en
AIzaSyAYiBZKx7MnpbEhh9jyipgxe19OcubqV5w
April 1, 2024
69592
Argentina
ARG
true
2
1
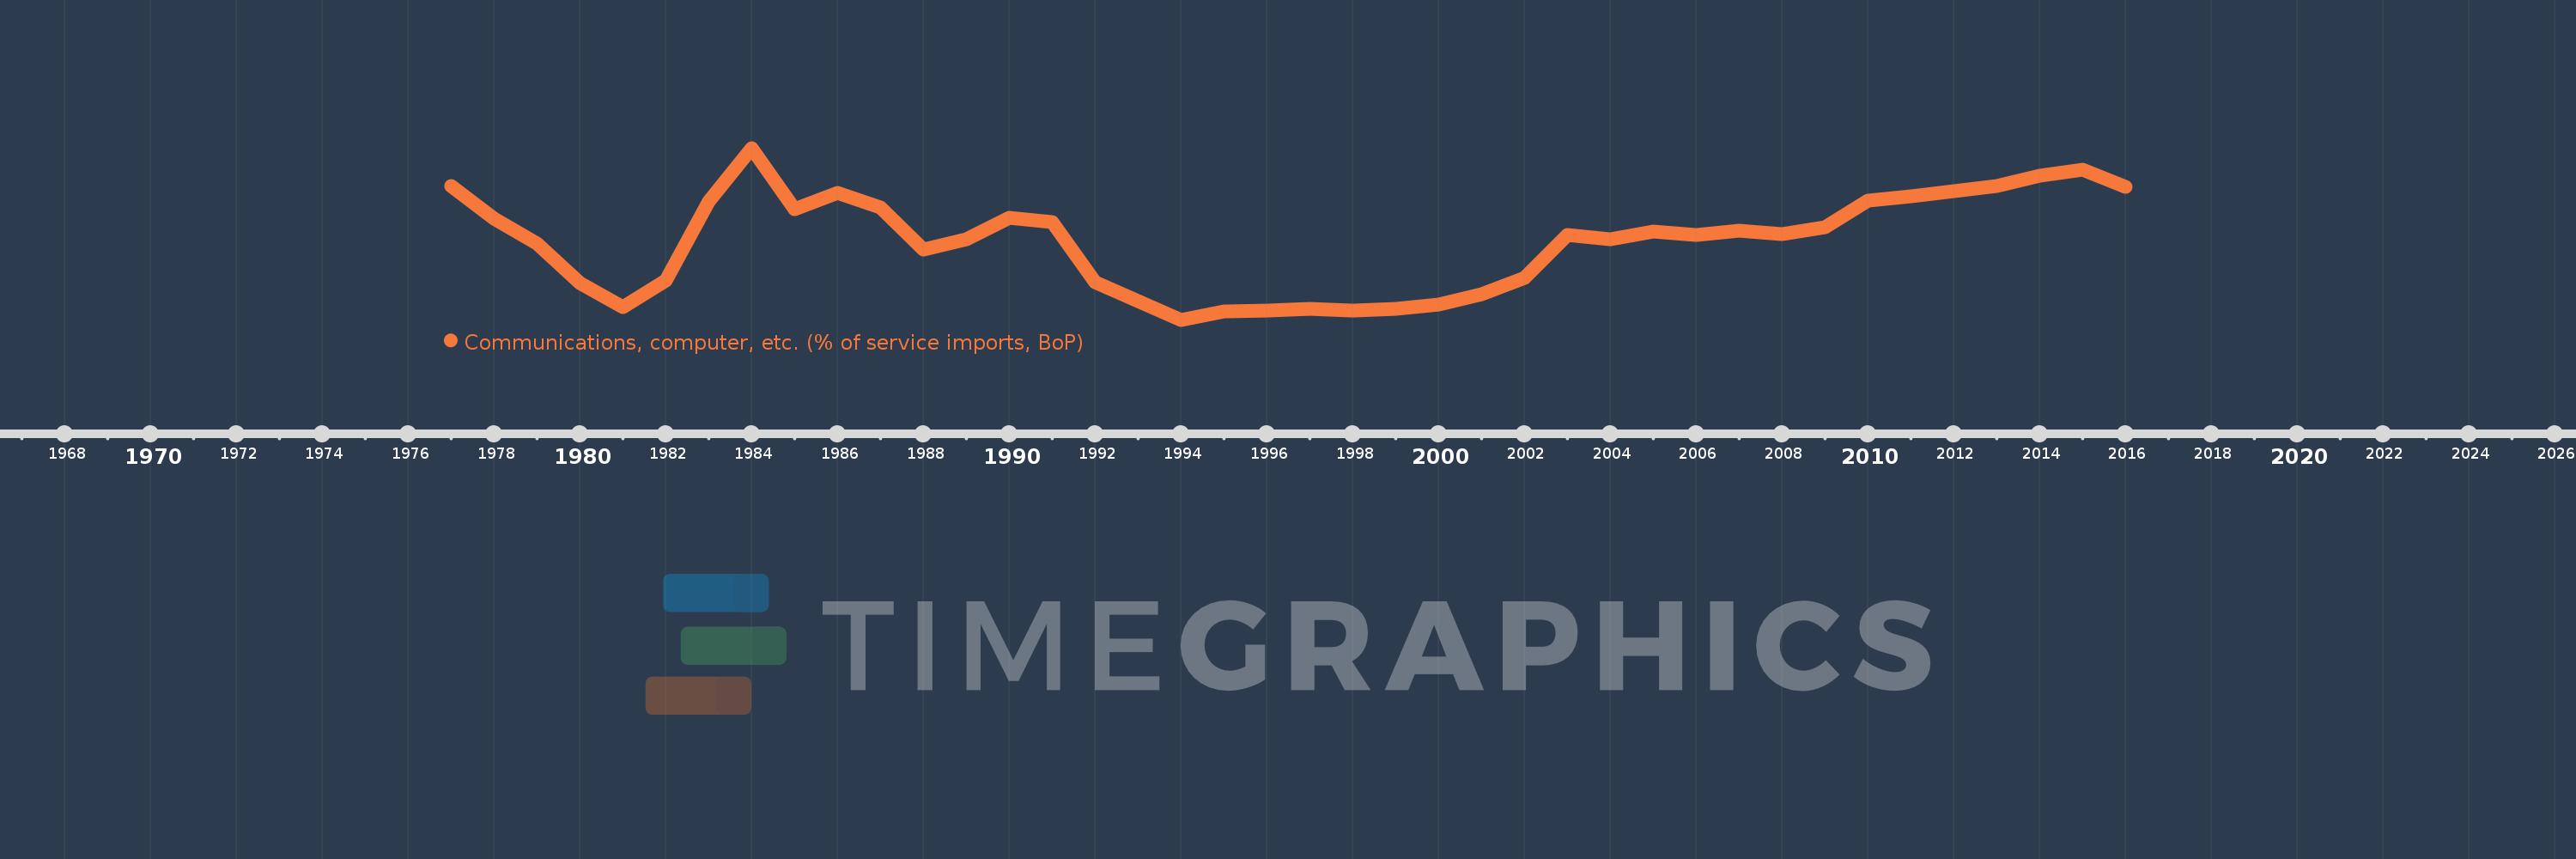
Communications, computer, etc. (% of service imports, BoP)
2016,2015,2014,2013,2012,2011,2010,2009,2008,2007,2006,2005,2004,2003,2002,2001,2000,1999,1998,1997,1996,1995,1994,1993,1992,1991,1990,1989,1988,1987,1986,1985,1984,1983,1982,1981,1980,1979,1978,1977
This statistics in other country:
AfghanistanAlbaniaAlgeriaAngolaAntigua and BarbudaArab WorldArgentinaArmeniaArubaAustraliaAustriaAzerbaijanBahamas, TheBahrainBangladeshBarbadosBelarusBelgiumBelizeBeninBermudaBhutanBoliviaBosnia and HerzegovinaBotswanaBrazilBrunei DarussalamBulgariaBurkina FasoBurundiCabo VerdeCambodiaCameroonCanadaCaribbean small statesCentral African RepublicCentral Europe and the BalticsChadChileChinaColombiaComorosCongo, Dem. Rep.Congo, Rep.Costa RicaCote d'IvoireCroatiaCuracaoCyprusCzech RepublicDenmarkDjiboutiDominicaDominican RepublicEarly-demographic dividendEast Asia & PacificEast Asia & Pacific (excluding high income)East Asia & Pacific (IDA & IBRD countries)EcuadorEgypt, Arab Rep.El SalvadorEquatorial GuineaEritreaEstoniaEthiopiaEuro areaEurope & Central AsiaEurope & Central Asia (excluding high income)Europe & Central Asia (IDA & IBRD countries)European UnionFaroe IslandsFijiFinlandFragile and conflict affected situationsFranceFrench PolynesiaGabonGambia, TheGeorgiaGermanyGhanaGreeceGrenadaGuatemalaGuineaGuinea-BissauGuyanaHaitiHeavily indebted poor countries (HIPC)High incomeHondurasHong Kong SAR, ChinaHungaryIBRD onlyIcelandIDA & IBRD totalIDA onlyIDA totalIndiaIndonesiaIran, Islamic Rep.IraqIrelandIsraelItalyJamaicaJapanJordanKazakhstanKenyaKiribatiKorea, Rep.KosovoKuwaitKyrgyz RepublicLao PDRLate-demographic dividendLatin America & Caribbean Latin America & Caribbean (excluding high income)Latin America & the Caribbean (IDA & IBRD countries)LatviaLeast developed countries: UN classificationLebanonLesothoLiberiaLibyaLithuaniaLow & middle incomeLow incomeLower middle incomeLuxembourgMacao SAR, ChinaMacedonia, FYRMadagascarMalawiMalaysiaMaldivesMaliMaltaMarshall IslandsMauritaniaMauritiusMexicoMicronesia, Fed. Sts.Middle East & North AfricaMiddle East & North Africa (excluding high income)Middle East & North Africa (IDA & IBRD countries)Middle incomeMoldovaMongoliaMontenegroMoroccoMozambiqueMyanmarNamibiaNepalNetherlandsNew CaledoniaNew ZealandNicaraguaNigerNigeriaNorth AmericaNorwayOECD membersOmanOther small statesPacific island small statesPakistanPalauPanamaPapua New GuineaParaguayPeruPhilippinesPolandPortugalPost-demographic dividendPre-demographic dividendQatarRomaniaRussian FederationRwandaSamoaSao Tome and PrincipeSaudi ArabiaSenegalSerbiaSeychellesSierra LeoneSingaporeSint Maarten (Dutch part)Slovak RepublicSloveniaSmall statesSolomon IslandsSouth AfricaSouth AsiaSouth Asia (IDA & IBRD)South SudanSpainSri LankaSt. Kitts and NevisSt. LuciaSt. Vincent and the GrenadinesSub-Saharan Africa Sub-Saharan Africa (excluding high income)Sub-Saharan Africa (IDA & IBRD countries)SudanSurinameSwazilandSwedenSwitzerlandSyrian Arab RepublicTajikistanTanzaniaThailandTimor-LesteTogoTongaTrinidad and TobagoTunisiaTurkeyTuvaluUgandaUkraineUnited KingdomUnited StatesUpper middle incomeUruguayVanuatuVenezuela, RBWest Bank and GazaWorldYemen, Rep.ZambiaZimbabwe Timeline:
This timeline shows a graph from 1977 to 2016 of Argentina. No data until 1976. Number of actual observations by date: 40.
Source name:
World Development Indicators
Source organization:
International Monetary Fund, Balance of Payments Statistics Yearbook and data files.
Categories, topics:
Economy & Growth, Trade
Last updated:
apr 23, 2017
Indicators value changes by year
Minimum:
17.126
jan 1, 1994
Maximum:
44.065
jan 1, 1984
At the date of observation
Value
Absolute change
Change from previous value
jan 1, 1977
38.14
+38.14
0.0%
jan 1, 1978
32.989
-5.152
-13.51%
jan 1, 1979
29.016
-3.973
-12.04%
jan 1, 1980
22.85
-6.166
-21.25%
jan 1, 1981
19.139
-3.711
-16.24%
jan 1, 1982
23.296
+4.157
21.72%
jan 1, 1983
35.728
+12.432
53.36%
jan 1, 1984
44.065
+8.336
23.33%
jan 1, 1985
34.513
-9.552
-21.68%
jan 1, 1986
37.037
+2.524
7.31%
jan 1, 1987
34.68
-2.357
-6.36%
jan 1, 1988
28.137
-6.543
-18.87%
jan 1, 1989
29.793
+1.656
5.88%
jan 1, 1990
33.047
+3.254
10.92%
jan 1, 1991
32.436
-0.611
-1.85%
jan 1, 1992
22.985
-9.451
-29.14%
jan 1, 1993
20.11
-2.875
-12.51%
jan 1, 1994
17.126
-2.983
-14.84%
jan 1, 1995
18.38
+1.254
7.32%
jan 1, 1996
18.609
+0.229
1.25%
jan 1, 1997
18.861
+0.252
1.35%
jan 1, 1998
18.599
-0.262
-1.39%
jan 1, 1999
18.87
+0.271
1.46%
jan 1, 2000
19.559
+0.689
3.65%
jan 1, 2001
21.163
+1.604
8.2%
jan 1, 2002
23.696
+2.533
11.97%
jan 1, 2003
30.404
+6.708
28.31%
jan 1, 2004
29.767
-0.637
-2.1%
jan 1, 2005
31.001
+1.235
4.15%
jan 1, 2006
30.408
-0.594
-1.91%
jan 1, 2007
31.029
+0.622
2.04%
jan 1, 2008
30.553
-0.476
-1.53%
jan 1, 2009
31.567
+1.014
3.32%
jan 1, 2010
35.789
+4.222
13.38%
jan 1, 2011
36.498
+0.709
1.98%
jan 1, 2012
37.287
+0.789
2.16%
jan 1, 2013
38.075
+0.788
2.11%
jan 1, 2014
39.678
+1.603
4.21%
jan 1, 2015
40.678
+1.0
2.52%
jan 1, 2016
37.91
-2.768
-6.8%
Ranking of countries by current statistics by years


Comments: