29
/
en
AIzaSyAYiBZKx7MnpbEhh9jyipgxe19OcubqV5w
April 1, 2024
207759
Netherlands
NLD
true
2
1
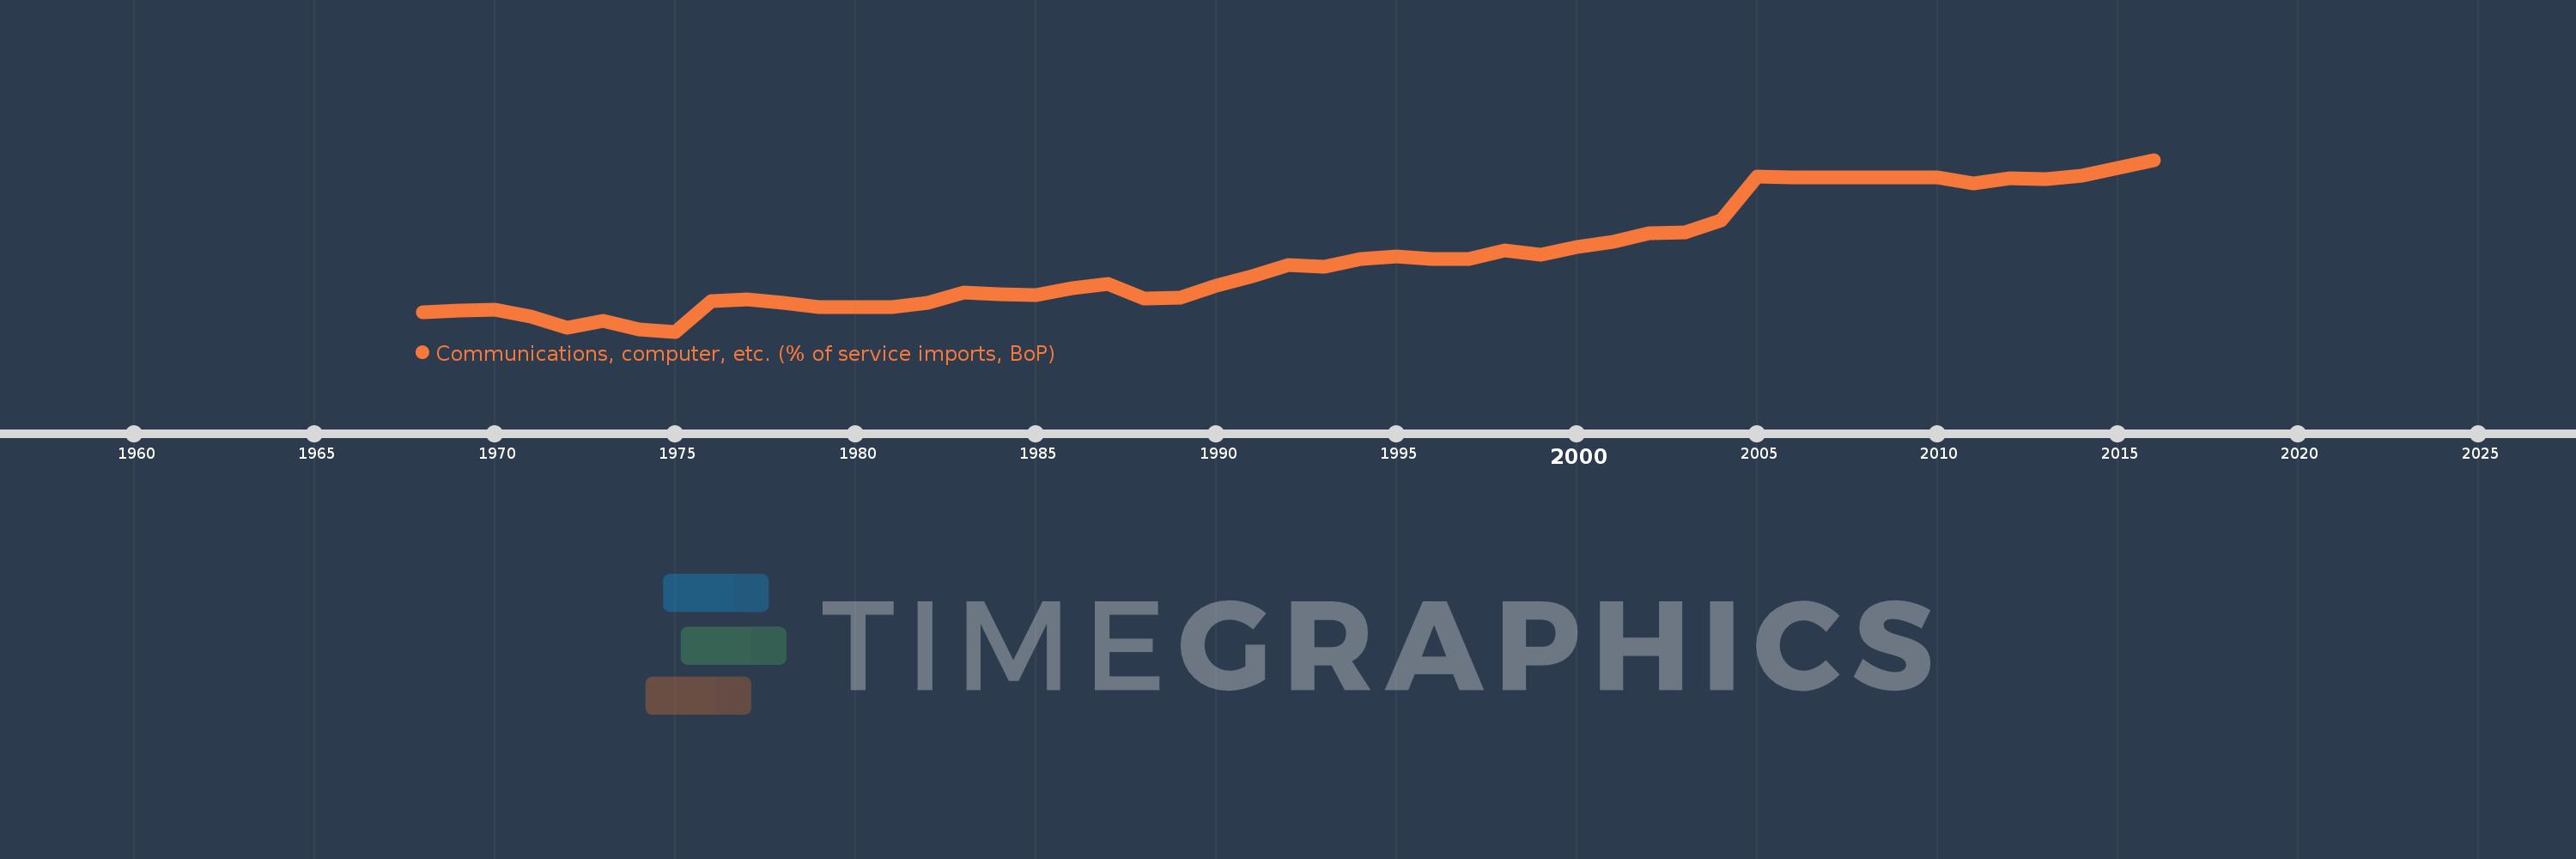
Communications, computer, etc. (% of service imports, BoP)
2016,2015,2014,2013,2012,2011,2010,2009,2008,2007,2006,2005,2004,2003,2002,2001,2000,1999,1998,1997,1996,1995,1994,1993,1992,1991,1990,1989,1988,1987,1986,1985,1984,1983,1982,1981,1980,1979,1978,1977,1976,1975,1974,1973,1972,1971,1970,1969,1968
This statistics in other country:
AfghanistanAlbaniaAlgeriaAngolaAntigua and BarbudaArab WorldArgentinaArmeniaArubaAustraliaAustriaAzerbaijanBahamas, TheBahrainBangladeshBarbadosBelarusBelgiumBelizeBeninBermudaBhutanBoliviaBosnia and HerzegovinaBotswanaBrazilBrunei DarussalamBulgariaBurkina FasoBurundiCabo VerdeCambodiaCameroonCanadaCaribbean small statesCentral African RepublicCentral Europe and the BalticsChadChileChinaColombiaComorosCongo, Dem. Rep.Congo, Rep.Costa RicaCote d'IvoireCroatiaCuracaoCyprusCzech RepublicDenmarkDjiboutiDominicaDominican RepublicEarly-demographic dividendEast Asia & PacificEast Asia & Pacific (excluding high income)East Asia & Pacific (IDA & IBRD countries)EcuadorEgypt, Arab Rep.El SalvadorEquatorial GuineaEritreaEstoniaEthiopiaEuro areaEurope & Central AsiaEurope & Central Asia (excluding high income)Europe & Central Asia (IDA & IBRD countries)European UnionFaroe IslandsFijiFinlandFragile and conflict affected situationsFranceFrench PolynesiaGabonGambia, TheGeorgiaGermanyGhanaGreeceGrenadaGuatemalaGuineaGuinea-BissauGuyanaHaitiHeavily indebted poor countries (HIPC)High incomeHondurasHong Kong SAR, ChinaHungaryIBRD onlyIcelandIDA & IBRD totalIDA onlyIDA totalIndiaIndonesiaIran, Islamic Rep.IraqIrelandIsraelItalyJamaicaJapanJordanKazakhstanKenyaKiribatiKorea, Rep.KosovoKuwaitKyrgyz RepublicLao PDRLate-demographic dividendLatin America & Caribbean Latin America & Caribbean (excluding high income)Latin America & the Caribbean (IDA & IBRD countries)LatviaLeast developed countries: UN classificationLebanonLesothoLiberiaLibyaLithuaniaLow & middle incomeLow incomeLower middle incomeLuxembourgMacao SAR, ChinaMacedonia, FYRMadagascarMalawiMalaysiaMaldivesMaliMaltaMarshall IslandsMauritaniaMauritiusMexicoMicronesia, Fed. Sts.Middle East & North AfricaMiddle East & North Africa (excluding high income)Middle East & North Africa (IDA & IBRD countries)Middle incomeMoldovaMongoliaMontenegroMoroccoMozambiqueMyanmarNamibiaNepalNetherlandsNew CaledoniaNew ZealandNicaraguaNigerNigeriaNorth AmericaNorwayOECD membersOmanOther small statesPacific island small statesPakistanPalauPanamaPapua New GuineaParaguayPeruPhilippinesPolandPortugalPost-demographic dividendPre-demographic dividendQatarRomaniaRussian FederationRwandaSamoaSao Tome and PrincipeSaudi ArabiaSenegalSerbiaSeychellesSierra LeoneSingaporeSint Maarten (Dutch part)Slovak RepublicSloveniaSmall statesSolomon IslandsSouth AfricaSouth AsiaSouth Asia (IDA & IBRD)South SudanSpainSri LankaSt. Kitts and NevisSt. LuciaSt. Vincent and the GrenadinesSub-Saharan Africa Sub-Saharan Africa (excluding high income)Sub-Saharan Africa (IDA & IBRD countries)SudanSurinameSwazilandSwedenSwitzerlandSyrian Arab RepublicTajikistanTanzaniaThailandTimor-LesteTogoTongaTrinidad and TobagoTunisiaTurkeyTuvaluUgandaUkraineUnited KingdomUnited StatesUpper middle incomeUruguayVanuatuVenezuela, RBWest Bank and GazaWorldYemen, Rep.ZambiaZimbabwe Timeline:
This timeline shows a graph from 1968 to 2016 of Netherlands. No data until 1967. Number of actual observations by date: 49.
Source name:
World Development Indicators
Source organization:
International Monetary Fund, Balance of Payments Statistics Yearbook and data files.
Categories, topics:
Economy & Growth, Trade
Last updated:
apr 23, 2017
Indicators value changes by year
Minimum:
22.967
jan 1, 1975
At the date of observation
Value
Absolute change
Change from previous value
jan 1, 1968
28.336
+28.336
0.0%
jan 1, 1969
28.828
+0.491
1.73%
jan 1, 1970
29.074
+0.246
0.85%
jan 1, 1971
27.272
-1.802
-6.2%
jan 1, 1972
24.127
-3.145
-11.53%
jan 1, 1973
25.917
+1.79
7.42%
jan 1, 1974
23.542
-2.375
-9.16%
jan 1, 1975
22.967
-0.575
-2.44%
jan 1, 1976
31.406
+8.439
36.74%
jan 1, 1977
32.018
+0.612
1.95%
jan 1, 1978
31.078
-0.94
-2.94%
jan 1, 1979
29.82
-1.258
-4.05%
jan 1, 1980
29.76
-0.06
-0.2%
jan 1, 1981
29.82
+0.059
0.2%
jan 1, 1982
31.087
+1.267
4.25%
jan 1, 1983
33.894
+2.808
9.03%
jan 1, 1984
33.34
-0.554
-1.64%
jan 1, 1985
33.115
-0.225
-0.67%
jan 1, 1986
35.037
+1.922
5.8%
jan 1, 1987
36.24
+1.203
3.43%
jan 1, 1988
32.237
-4.002
-11.04%
jan 1, 1989
32.572
+0.335
1.04%
jan 1, 1990
35.915
+3.343
10.26%
jan 1, 1991
38.57
+2.655
7.39%
jan 1, 1992
41.619
+3.049
7.9%
jan 1, 1993
41.232
-0.386
-0.93%
jan 1, 1994
43.212
+1.98
4.8%
jan 1, 1995
44.133
+0.921
2.13%
jan 1, 1996
43.246
-0.887
-2.01%
jan 1, 1997
43.334
+0.088
0.2%
jan 1, 1998
45.635
+2.301
5.31%
jan 1, 1999
44.409
-1.226
-2.69%
jan 1, 2000
46.673
+2.263
5.1%
jan 1, 2001
48.012
+1.339
2.87%
jan 1, 2002
50.515
+2.503
5.21%
jan 1, 2003
50.681
+0.167
0.33%
jan 1, 2004
54.132
+3.45
6.81%
jan 1, 2005
66.276
+12.144
22.43%
jan 1, 2006
66.122
-0.153
-0.23%
jan 1, 2007
66.176
+0.054
0.08%
jan 1, 2008
66.232
+0.056
0.09%
jan 1, 2009
66.037
-0.195
-0.29%
jan 1, 2010
66.147
+0.11
0.17%
jan 1, 2011
64.56
-1.587
-2.4%
jan 1, 2012
65.849
+1.289
2.0%
jan 1, 2013
65.65
-0.2
-0.3%
jan 1, 2014
66.525
+0.876
1.33%
jan 1, 2015
68.805
+2.28
3.43%
jan 1, 2016
71.08
+2.275
3.31%
Ranking of countries by current statistics by years


Comments: