29
/
en
AIzaSyAYiBZKx7MnpbEhh9jyipgxe19OcubqV5w
April 1, 2024
234474
Saudi Arabia
SAU
true
2
1
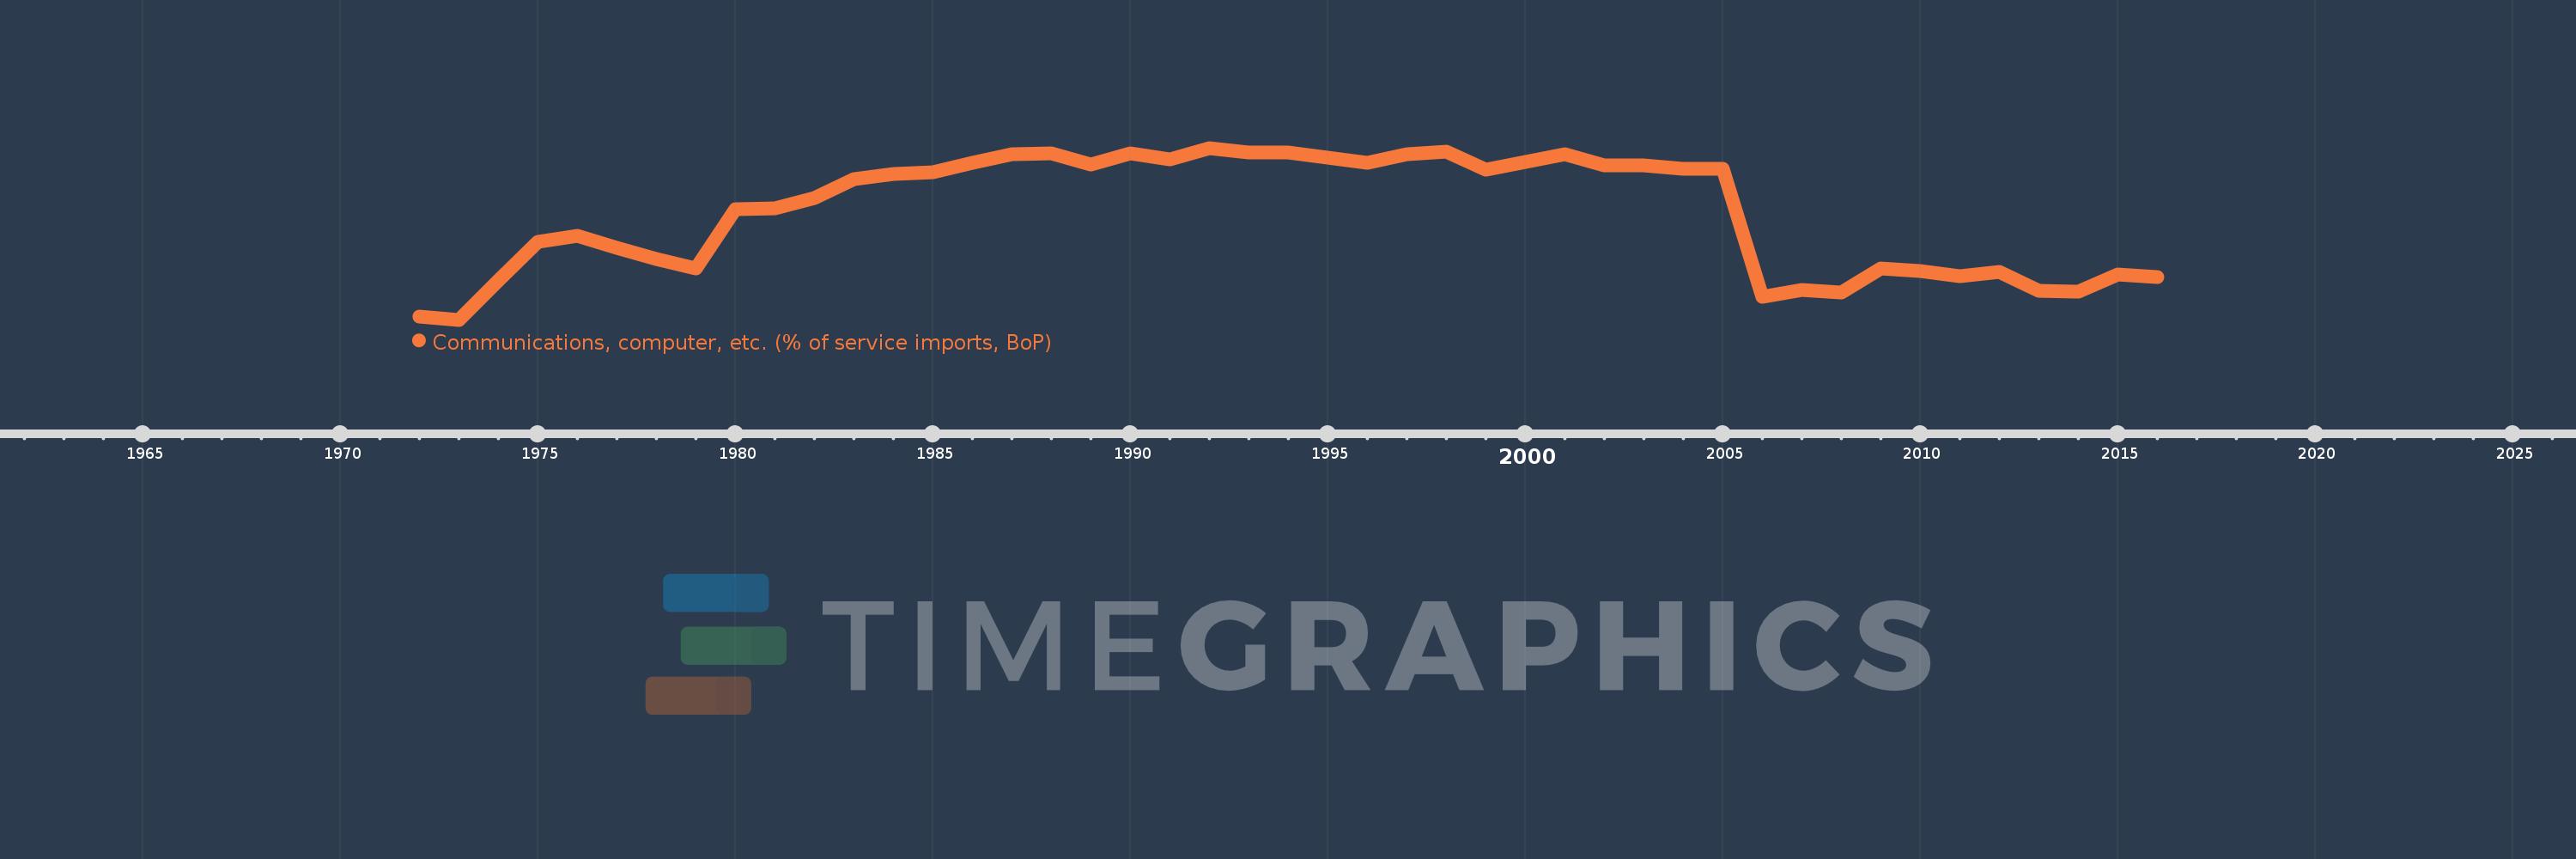
Communications, computer, etc. (% of service imports, BoP)
2016,2015,2014,2013,2012,2011,2010,2009,2008,2007,2006,2005,2004,2003,2002,2001,2000,1999,1998,1997,1996,1995,1994,1993,1992,1991,1990,1989,1988,1987,1986,1985,1984,1983,1982,1981,1980,1979,1978,1977,1976,1975,1974,1973,1972
This statistics in other country:
AfghanistanAlbaniaAlgeriaAngolaAntigua and BarbudaArab WorldArgentinaArmeniaArubaAustraliaAustriaAzerbaijanBahamas, TheBahrainBangladeshBarbadosBelarusBelgiumBelizeBeninBermudaBhutanBoliviaBosnia and HerzegovinaBotswanaBrazilBrunei DarussalamBulgariaBurkina FasoBurundiCabo VerdeCambodiaCameroonCanadaCaribbean small statesCentral African RepublicCentral Europe and the BalticsChadChileChinaColombiaComorosCongo, Dem. Rep.Congo, Rep.Costa RicaCote d'IvoireCroatiaCuracaoCyprusCzech RepublicDenmarkDjiboutiDominicaDominican RepublicEarly-demographic dividendEast Asia & PacificEast Asia & Pacific (excluding high income)East Asia & Pacific (IDA & IBRD countries)EcuadorEgypt, Arab Rep.El SalvadorEquatorial GuineaEritreaEstoniaEthiopiaEuro areaEurope & Central AsiaEurope & Central Asia (excluding high income)Europe & Central Asia (IDA & IBRD countries)European UnionFaroe IslandsFijiFinlandFragile and conflict affected situationsFranceFrench PolynesiaGabonGambia, TheGeorgiaGermanyGhanaGreeceGrenadaGuatemalaGuineaGuinea-BissauGuyanaHaitiHeavily indebted poor countries (HIPC)High incomeHondurasHong Kong SAR, ChinaHungaryIBRD onlyIcelandIDA & IBRD totalIDA onlyIDA totalIndiaIndonesiaIran, Islamic Rep.IraqIrelandIsraelItalyJamaicaJapanJordanKazakhstanKenyaKiribatiKorea, Rep.KosovoKuwaitKyrgyz RepublicLao PDRLate-demographic dividendLatin America & Caribbean Latin America & Caribbean (excluding high income)Latin America & the Caribbean (IDA & IBRD countries)LatviaLeast developed countries: UN classificationLebanonLesothoLiberiaLibyaLithuaniaLow & middle incomeLow incomeLower middle incomeLuxembourgMacao SAR, ChinaMacedonia, FYRMadagascarMalawiMalaysiaMaldivesMaliMaltaMarshall IslandsMauritaniaMauritiusMexicoMicronesia, Fed. Sts.Middle East & North AfricaMiddle East & North Africa (excluding high income)Middle East & North Africa (IDA & IBRD countries)Middle incomeMoldovaMongoliaMontenegroMoroccoMozambiqueMyanmarNamibiaNepalNetherlandsNew CaledoniaNew ZealandNicaraguaNigerNigeriaNorth AmericaNorwayOECD membersOmanOther small statesPacific island small statesPakistanPalauPanamaPapua New GuineaParaguayPeruPhilippinesPolandPortugalPost-demographic dividendPre-demographic dividendQatarRomaniaRussian FederationRwandaSamoaSao Tome and PrincipeSaudi ArabiaSenegalSerbiaSeychellesSierra LeoneSingaporeSint Maarten (Dutch part)Slovak RepublicSloveniaSmall statesSolomon IslandsSouth AfricaSouth AsiaSouth Asia (IDA & IBRD)South SudanSpainSri LankaSt. Kitts and NevisSt. LuciaSt. Vincent and the GrenadinesSub-Saharan Africa Sub-Saharan Africa (excluding high income)Sub-Saharan Africa (IDA & IBRD countries)SudanSurinameSwazilandSwedenSwitzerlandSyrian Arab RepublicTajikistanTanzaniaThailandTimor-LesteTogoTongaTrinidad and TobagoTunisiaTurkeyTuvaluUgandaUkraineUnited KingdomUnited StatesUpper middle incomeUruguayVanuatuVenezuela, RBWest Bank and GazaWorldYemen, Rep.ZambiaZimbabwe Timeline:
This timeline shows a graph from 1972 to 2016 of Saudi Arabia. No data until 1971. Number of actual observations by date: 45.
Source name:
World Development Indicators
Source organization:
International Monetary Fund, Balance of Payments Statistics Yearbook and data files.
Categories, topics:
Economy & Growth, Trade
Last updated:
apr 23, 2017
Indicators value changes by year
Minimum:
38.863
jan 1, 1973
Maximum:
91.969
jan 1, 1992
At the date of observation
Value
Absolute change
Change from previous value
jan 1, 1972
39.881
+39.881
0.0%
jan 1, 1973
38.863
-1.018
-2.55%
jan 1, 1974
51.13
+12.267
31.57%
jan 1, 1975
63.021
+11.891
23.26%
jan 1, 1976
64.847
+1.826
2.9%
jan 1, 1977
61.085
-3.762
-5.8%
jan 1, 1978
57.608
-3.477
-5.69%
jan 1, 1979
54.74
-2.868
-4.98%
jan 1, 1980
72.922
+18.182
33.21%
jan 1, 1981
73.282
+0.36
0.49%
jan 1, 1982
76.569
+3.286
4.48%
jan 1, 1983
82.215
+5.646
7.37%
jan 1, 1984
83.95
+1.735
2.11%
jan 1, 1985
84.358
+0.409
0.49%
jan 1, 1986
87.384
+3.025
3.59%
jan 1, 1987
89.935
+2.551
2.92%
jan 1, 1988
90.286
+0.352
0.39%
jan 1, 1989
86.733
-3.553
-3.94%
jan 1, 1990
90.326
+3.593
4.14%
jan 1, 1991
88.492
-1.835
-2.03%
jan 1, 1992
91.969
+3.478
3.93%
jan 1, 1993
90.63
-1.339
-1.46%
jan 1, 1994
90.481
-0.149
-0.16%
jan 1, 1995
88.985
-1.496
-1.65%
jan 1, 1996
87.363
-1.623
-1.82%
jan 1, 1997
90.095
+2.732
3.13%
jan 1, 1998
90.859
+0.764
0.85%
jan 1, 1999
85.321
-5.538
-6.1%
jan 1, 2000
87.724
+2.403
2.82%
jan 1, 2001
90.117
+2.393
2.73%
jan 1, 2002
86.647
-3.47
-3.85%
jan 1, 2003
86.656
+0.009
0.01%
jan 1, 2004
85.386
-1.269
-1.46%
jan 1, 2005
85.622
+0.236
0.28%
jan 1, 2006
45.948
-39.674
-46.34%
jan 1, 2007
48.082
+2.134
4.64%
jan 1, 2008
47.248
-0.834
-1.73%
jan 1, 2009
54.657
+7.409
15.68%
jan 1, 2010
53.981
-0.676
-1.24%
jan 1, 2011
52.377
-1.603
-2.97%
jan 1, 2012
53.615
+1.238
2.36%
jan 1, 2013
47.87
-5.746
-10.72%
jan 1, 2014
47.535
-0.335
-0.7%
jan 1, 2015
52.946
+5.411
11.38%
jan 1, 2016
52.095
-0.851
-1.61%
Ranking of countries by current statistics by years


Comments: