29
/
en
AIzaSyAYiBZKx7MnpbEhh9jyipgxe19OcubqV5w
April 1, 2024
257129
Switzerland
CHE
true
2
1
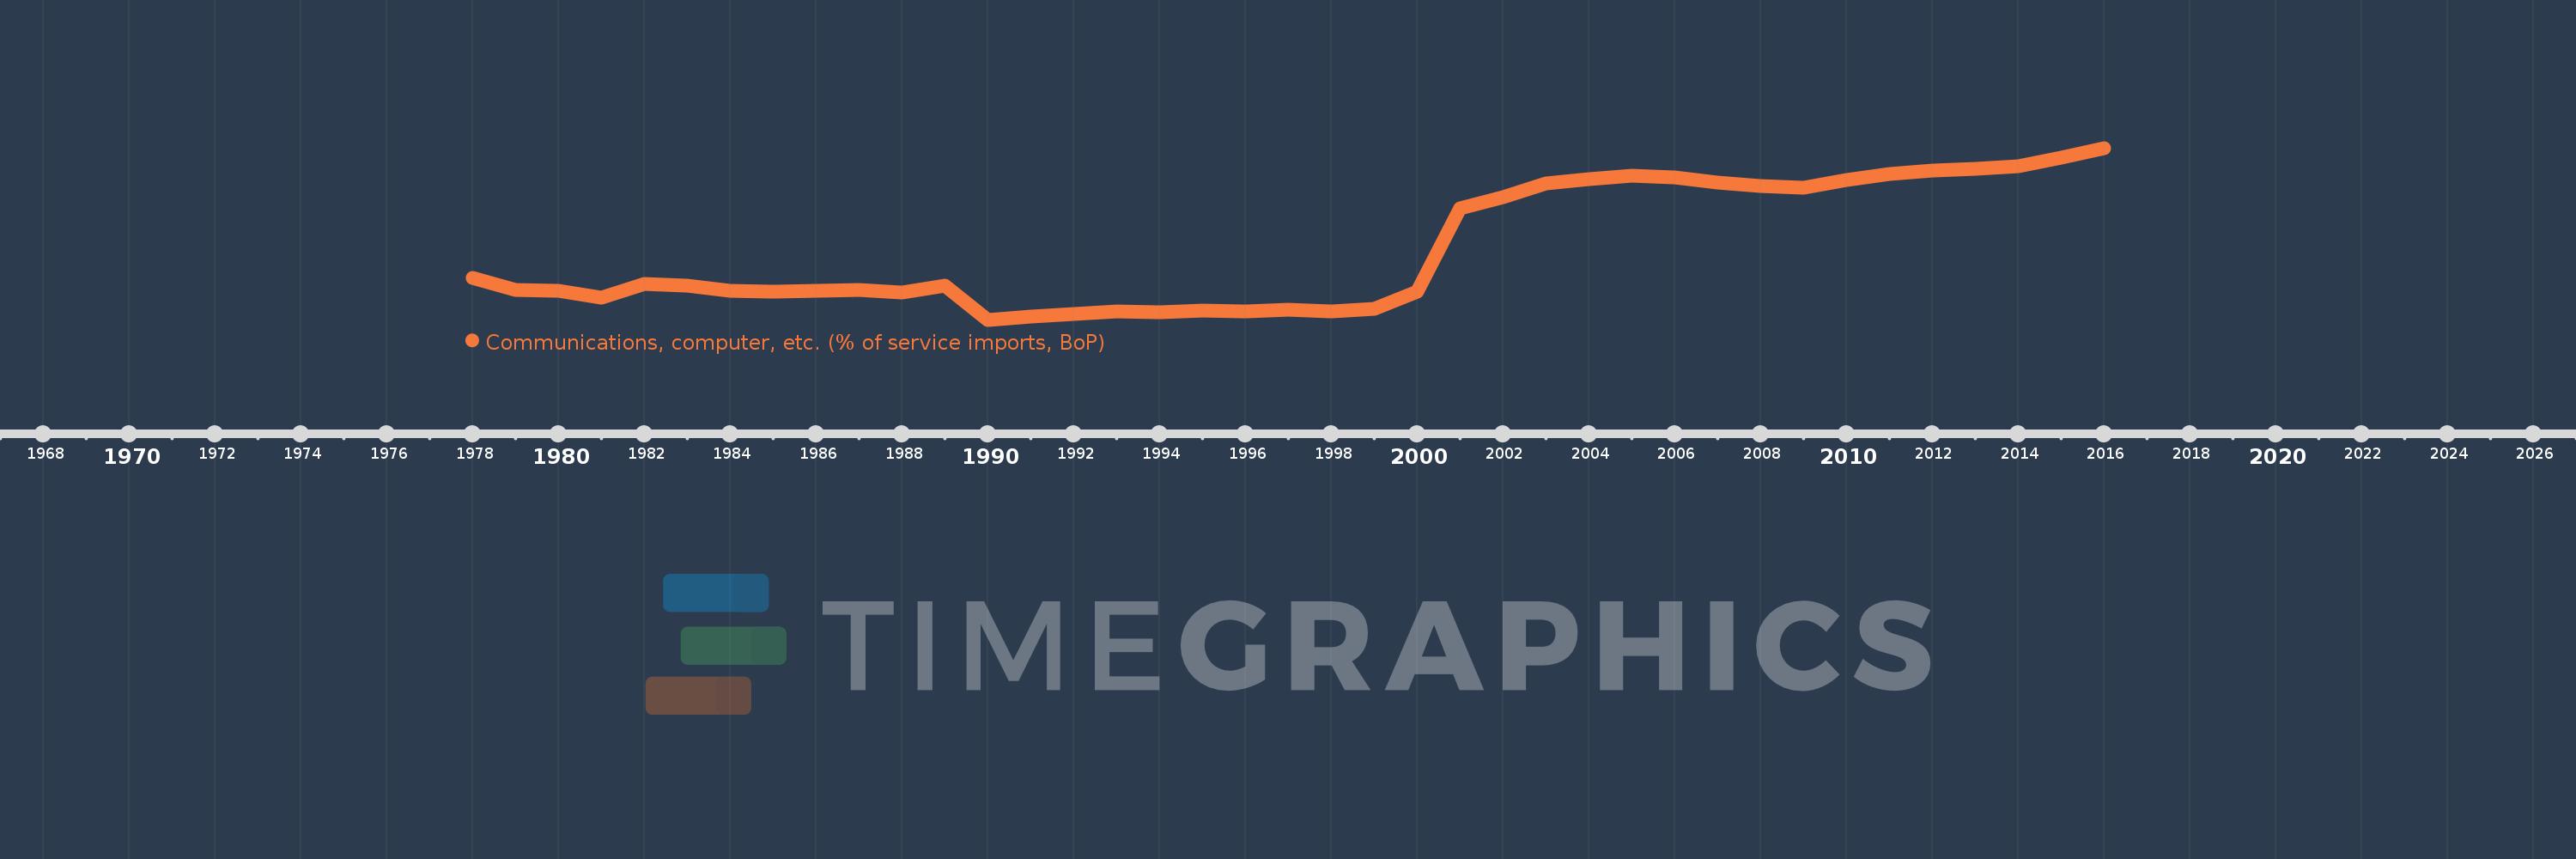
Communications, computer, etc. (% of service imports, BoP)
2016,2015,2014,2013,2012,2011,2010,2009,2008,2007,2006,2005,2004,2003,2002,2001,2000,1999,1998,1997,1996,1995,1994,1993,1992,1991,1990,1989,1988,1987,1986,1985,1984,1983,1982,1981,1980,1979,1978
This statistics in other country:
AfghanistanAlbaniaAlgeriaAngolaAntigua and BarbudaArab WorldArgentinaArmeniaArubaAustraliaAustriaAzerbaijanBahamas, TheBahrainBangladeshBarbadosBelarusBelgiumBelizeBeninBermudaBhutanBoliviaBosnia and HerzegovinaBotswanaBrazilBrunei DarussalamBulgariaBurkina FasoBurundiCabo VerdeCambodiaCameroonCanadaCaribbean small statesCentral African RepublicCentral Europe and the BalticsChadChileChinaColombiaComorosCongo, Dem. Rep.Congo, Rep.Costa RicaCote d'IvoireCroatiaCuracaoCyprusCzech RepublicDenmarkDjiboutiDominicaDominican RepublicEarly-demographic dividendEast Asia & PacificEast Asia & Pacific (excluding high income)East Asia & Pacific (IDA & IBRD countries)EcuadorEgypt, Arab Rep.El SalvadorEquatorial GuineaEritreaEstoniaEthiopiaEuro areaEurope & Central AsiaEurope & Central Asia (excluding high income)Europe & Central Asia (IDA & IBRD countries)European UnionFaroe IslandsFijiFinlandFragile and conflict affected situationsFranceFrench PolynesiaGabonGambia, TheGeorgiaGermanyGhanaGreeceGrenadaGuatemalaGuineaGuinea-BissauGuyanaHaitiHeavily indebted poor countries (HIPC)High incomeHondurasHong Kong SAR, ChinaHungaryIBRD onlyIcelandIDA & IBRD totalIDA onlyIDA totalIndiaIndonesiaIran, Islamic Rep.IraqIrelandIsraelItalyJamaicaJapanJordanKazakhstanKenyaKiribatiKorea, Rep.KosovoKuwaitKyrgyz RepublicLao PDRLate-demographic dividendLatin America & Caribbean Latin America & Caribbean (excluding high income)Latin America & the Caribbean (IDA & IBRD countries)LatviaLeast developed countries: UN classificationLebanonLesothoLiberiaLibyaLithuaniaLow & middle incomeLow incomeLower middle incomeLuxembourgMacao SAR, ChinaMacedonia, FYRMadagascarMalawiMalaysiaMaldivesMaliMaltaMarshall IslandsMauritaniaMauritiusMexicoMicronesia, Fed. Sts.Middle East & North AfricaMiddle East & North Africa (excluding high income)Middle East & North Africa (IDA & IBRD countries)Middle incomeMoldovaMongoliaMontenegroMoroccoMozambiqueMyanmarNamibiaNepalNetherlandsNew CaledoniaNew ZealandNicaraguaNigerNigeriaNorth AmericaNorwayOECD membersOmanOther small statesPacific island small statesPakistanPalauPanamaPapua New GuineaParaguayPeruPhilippinesPolandPortugalPost-demographic dividendPre-demographic dividendQatarRomaniaRussian FederationRwandaSamoaSao Tome and PrincipeSaudi ArabiaSenegalSerbiaSeychellesSierra LeoneSingaporeSint Maarten (Dutch part)Slovak RepublicSloveniaSmall statesSolomon IslandsSouth AfricaSouth AsiaSouth Asia (IDA & IBRD)South SudanSpainSri LankaSt. Kitts and NevisSt. LuciaSt. Vincent and the GrenadinesSub-Saharan Africa Sub-Saharan Africa (excluding high income)Sub-Saharan Africa (IDA & IBRD countries)SudanSurinameSwazilandSwedenSwitzerlandSyrian Arab RepublicTajikistanTanzaniaThailandTimor-LesteTogoTongaTrinidad and TobagoTunisiaTurkeyTuvaluUgandaUkraineUnited KingdomUnited StatesUpper middle incomeUruguayVanuatuVenezuela, RBWest Bank and GazaWorldYemen, Rep.ZambiaZimbabwe Timeline:
This timeline shows a graph from 1978 to 2016 of Switzerland. No data until 1977. Number of actual observations by date: 39.
Source name:
World Development Indicators
Source organization:
International Monetary Fund, Balance of Payments Statistics Yearbook and data files.
Categories, topics:
Economy & Growth, Trade
Last updated:
apr 23, 2017
Indicators value changes by year
Minimum:
11.734
jan 1, 1990
Maximum:
69.311
jan 1, 2016
At the date of observation
Value
Absolute change
Change from previous value
jan 1, 1978
25.687
+25.687
0.0%
jan 1, 1979
21.731
-3.956
-15.4%
jan 1, 1980
21.503
-0.228
-1.05%
jan 1, 1981
19.264
-2.239
-10.41%
jan 1, 1982
23.839
+4.575
23.75%
jan 1, 1983
23.29
-0.548
-2.3%
jan 1, 1984
21.465
-1.826
-7.84%
jan 1, 1985
21.032
-0.432
-2.01%
jan 1, 1986
21.424
+0.391
1.86%
jan 1, 1987
21.669
+0.246
1.15%
jan 1, 1988
20.849
-0.82
-3.79%
jan 1, 1989
23.265
+2.416
11.59%
jan 1, 1990
11.734
-11.531
-49.56%
jan 1, 1991
12.897
+1.162
9.9%
jan 1, 1992
13.561
+0.665
5.15%
jan 1, 1993
14.472
+0.911
6.72%
jan 1, 1994
14.229
-0.244
-1.68%
jan 1, 1995
14.77
+0.542
3.81%
jan 1, 1996
14.658
-0.112
-0.76%
jan 1, 1997
15.098
+0.439
3.0%
jan 1, 1998
14.49
-0.608
-4.02%
jan 1, 1999
15.481
+0.991
6.84%
jan 1, 2000
21.268
+5.788
37.39%
jan 1, 2001
49.041
+27.772
130.58%
jan 1, 2002
52.723
+3.682
7.51%
jan 1, 2003
57.546
+4.823
9.15%
jan 1, 2004
58.783
+1.237
2.15%
jan 1, 2005
60.033
+1.25
2.13%
jan 1, 2006
59.546
-0.487
-0.81%
jan 1, 2007
57.567
-1.979
-3.32%
jan 1, 2008
56.523
-1.044
-1.81%
jan 1, 2009
55.91
-0.613
-1.08%
jan 1, 2010
58.696
+2.785
4.98%
jan 1, 2011
60.545
+1.849
3.15%
jan 1, 2012
61.872
+1.328
2.19%
jan 1, 2013
62.441
+0.568
0.92%
jan 1, 2014
63.267
+0.826
1.32%
jan 1, 2015
66.088
+2.821
4.46%
jan 1, 2016
69.311
+3.223
4.88%
Ranking of countries by current statistics by years


Comments: