29
/
en
AIzaSyAYiBZKx7MnpbEhh9jyipgxe19OcubqV5w
April 1, 2024
212744
Nigeria
NGA
true
2
1
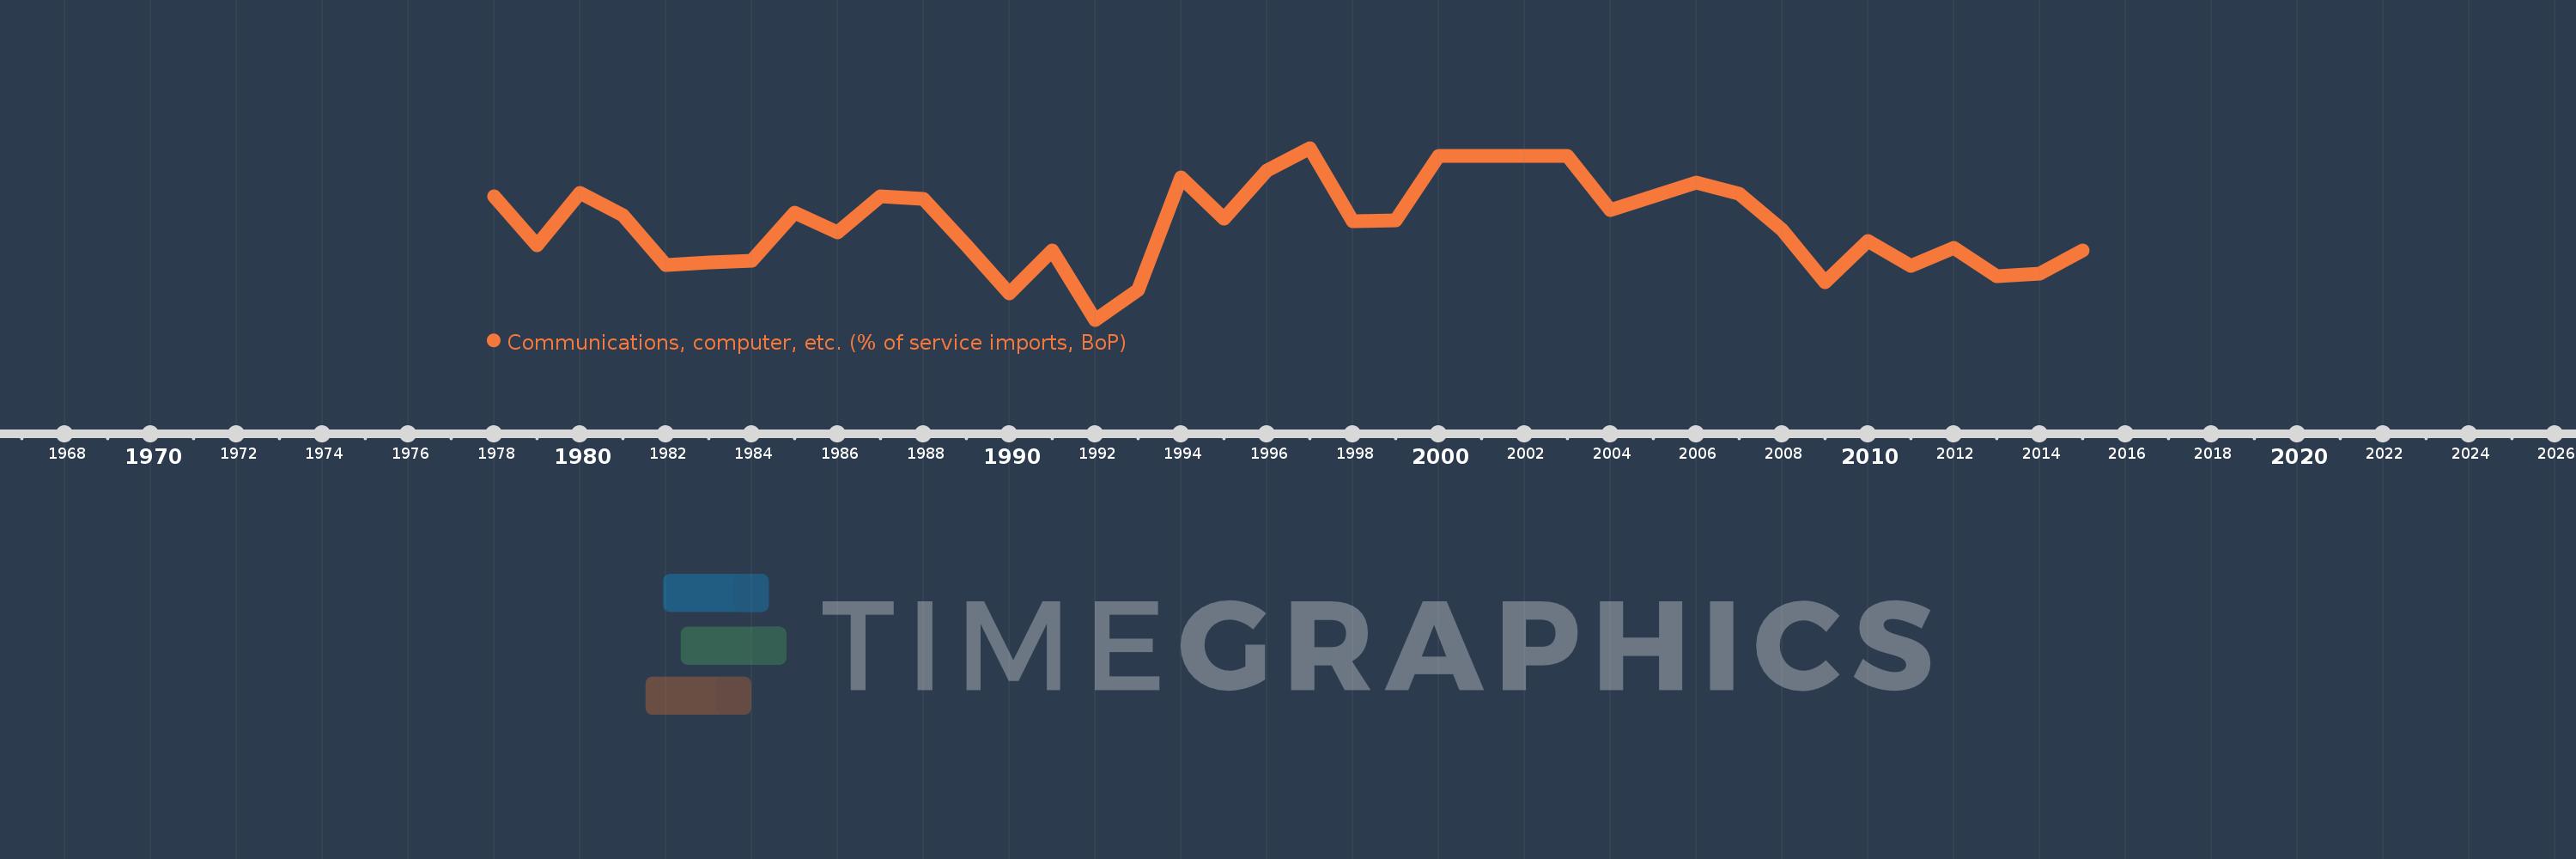
Communications, computer, etc. (% of service imports, BoP)
2015,2014,2013,2012,2011,2010,2009,2008,2007,2006,2004,2003,2002,2001,2000,1999,1998,1997,1996,1995,1994,1993,1992,1991,1990,1989,1988,1987,1986,1985,1984,1983,1982,1981,1980,1979,1978
This statistics in other country:
AfghanistanAlbaniaAlgeriaAngolaAntigua and BarbudaArab WorldArgentinaArmeniaArubaAustraliaAustriaAzerbaijanBahamas, TheBahrainBangladeshBarbadosBelarusBelgiumBelizeBeninBermudaBhutanBoliviaBosnia and HerzegovinaBotswanaBrazilBrunei DarussalamBulgariaBurkina FasoBurundiCabo VerdeCambodiaCameroonCanadaCaribbean small statesCentral African RepublicCentral Europe and the BalticsChadChileChinaColombiaComorosCongo, Dem. Rep.Congo, Rep.Costa RicaCote d'IvoireCroatiaCuracaoCyprusCzech RepublicDenmarkDjiboutiDominicaDominican RepublicEarly-demographic dividendEast Asia & PacificEast Asia & Pacific (excluding high income)East Asia & Pacific (IDA & IBRD countries)EcuadorEgypt, Arab Rep.El SalvadorEquatorial GuineaEritreaEstoniaEthiopiaEuro areaEurope & Central AsiaEurope & Central Asia (excluding high income)Europe & Central Asia (IDA & IBRD countries)European UnionFaroe IslandsFijiFinlandFragile and conflict affected situationsFranceFrench PolynesiaGabonGambia, TheGeorgiaGermanyGhanaGreeceGrenadaGuatemalaGuineaGuinea-BissauGuyanaHaitiHeavily indebted poor countries (HIPC)High incomeHondurasHong Kong SAR, ChinaHungaryIBRD onlyIcelandIDA & IBRD totalIDA onlyIDA totalIndiaIndonesiaIran, Islamic Rep.IraqIrelandIsraelItalyJamaicaJapanJordanKazakhstanKenyaKiribatiKorea, Rep.KosovoKuwaitKyrgyz RepublicLao PDRLate-demographic dividendLatin America & Caribbean Latin America & Caribbean (excluding high income)Latin America & the Caribbean (IDA & IBRD countries)LatviaLeast developed countries: UN classificationLebanonLesothoLiberiaLibyaLithuaniaLow & middle incomeLow incomeLower middle incomeLuxembourgMacao SAR, ChinaMacedonia, FYRMadagascarMalawiMalaysiaMaldivesMaliMaltaMarshall IslandsMauritaniaMauritiusMexicoMicronesia, Fed. Sts.Middle East & North AfricaMiddle East & North Africa (excluding high income)Middle East & North Africa (IDA & IBRD countries)Middle incomeMoldovaMongoliaMontenegroMoroccoMozambiqueMyanmarNamibiaNepalNetherlandsNew CaledoniaNew ZealandNicaraguaNigerNigeriaNorth AmericaNorwayOECD membersOmanOther small statesPacific island small statesPakistanPalauPanamaPapua New GuineaParaguayPeruPhilippinesPolandPortugalPost-demographic dividendPre-demographic dividendQatarRomaniaRussian FederationRwandaSamoaSao Tome and PrincipeSaudi ArabiaSenegalSerbiaSeychellesSierra LeoneSingaporeSint Maarten (Dutch part)Slovak RepublicSloveniaSmall statesSolomon IslandsSouth AfricaSouth AsiaSouth Asia (IDA & IBRD)South SudanSpainSri LankaSt. Kitts and NevisSt. LuciaSt. Vincent and the GrenadinesSub-Saharan Africa Sub-Saharan Africa (excluding high income)Sub-Saharan Africa (IDA & IBRD countries)SudanSurinameSwazilandSwedenSwitzerlandSyrian Arab RepublicTajikistanTanzaniaThailandTimor-LesteTogoTongaTrinidad and TobagoTunisiaTurkeyTuvaluUgandaUkraineUnited KingdomUnited StatesUpper middle incomeUruguayVanuatuVenezuela, RBWest Bank and GazaWorldYemen, Rep.ZambiaZimbabwe Timeline:
This timeline shows a graph from 1978 to 2015 of Nigeria. No data until 1977. Number of actual observations by date: 37.
Source name:
World Development Indicators
Source organization:
International Monetary Fund, Balance of Payments Statistics Yearbook and data files.
Categories, topics:
Economy & Growth, Trade
Last updated:
apr 23, 2017
Indicators value changes by year
Minimum:
17.242
jan 1, 1992
Maximum:
62.608
jan 1, 1997
At the date of observation
Value
Absolute change
Change from previous value
jan 1, 1978
49.738
+49.738
0.0%
jan 1, 1979
36.87
-12.868
-25.87%
jan 1, 1980
50.675
+13.805
37.44%
jan 1, 1981
44.844
-5.831
-11.51%
jan 1, 1982
31.798
-13.047
-29.09%
jan 1, 1983
32.4
+0.602
1.89%
jan 1, 1984
32.831
+0.432
1.33%
jan 1, 1985
45.613
+12.781
38.93%
jan 1, 1986
40.405
-5.207
-11.42%
jan 1, 1987
49.768
+9.363
23.17%
jan 1, 1988
49.243
-0.525
-1.06%
jan 1, 1989
36.979
-12.264
-24.9%
jan 1, 1990
24.123
-12.856
-34.77%
jan 1, 1991
35.474
+11.35
47.05%
jan 1, 1992
17.242
-18.232
-51.4%
jan 1, 1993
25.13
+7.889
45.75%
jan 1, 1994
54.827
+29.697
118.17%
jan 1, 1995
43.83
-10.997
-20.06%
jan 1, 1996
56.581
+12.751
29.09%
jan 1, 1997
62.608
+6.027
10.65%
jan 1, 1998
43.331
-19.277
-30.79%
jan 1, 1999
43.43
+0.099
0.23%
jan 1, 2000
60.566
+17.136
39.46%
jan 1, 2001
60.52
-0.046
-0.08%
jan 1, 2002
60.52
0.0
0.0%
jan 1, 2003
60.52
+0.0
0.0%
jan 1, 2004
46.136
-14.384
-23.77%
jan 1, 2006
53.423
+7.287
15.79%
jan 1, 2007
50.449
-2.974
-5.57%
jan 1, 2008
41.082
-9.367
-18.57%
jan 1, 2009
27.253
-13.828
-33.66%
jan 1, 2010
38.138
+10.885
39.94%
jan 1, 2011
31.527
-6.611
-17.34%
jan 1, 2012
36.138
+4.611
14.62%
jan 1, 2013
28.839
-7.299
-20.2%
jan 1, 2014
29.506
+0.667
2.31%
jan 1, 2015
35.64
+6.134
20.79%
Ranking of countries by current statistics by years


Comments: