29
/
en
AIzaSyAYiBZKx7MnpbEhh9jyipgxe19OcubqV5w
April 1, 2024
36429
IBRD only
IBD
false
2
1
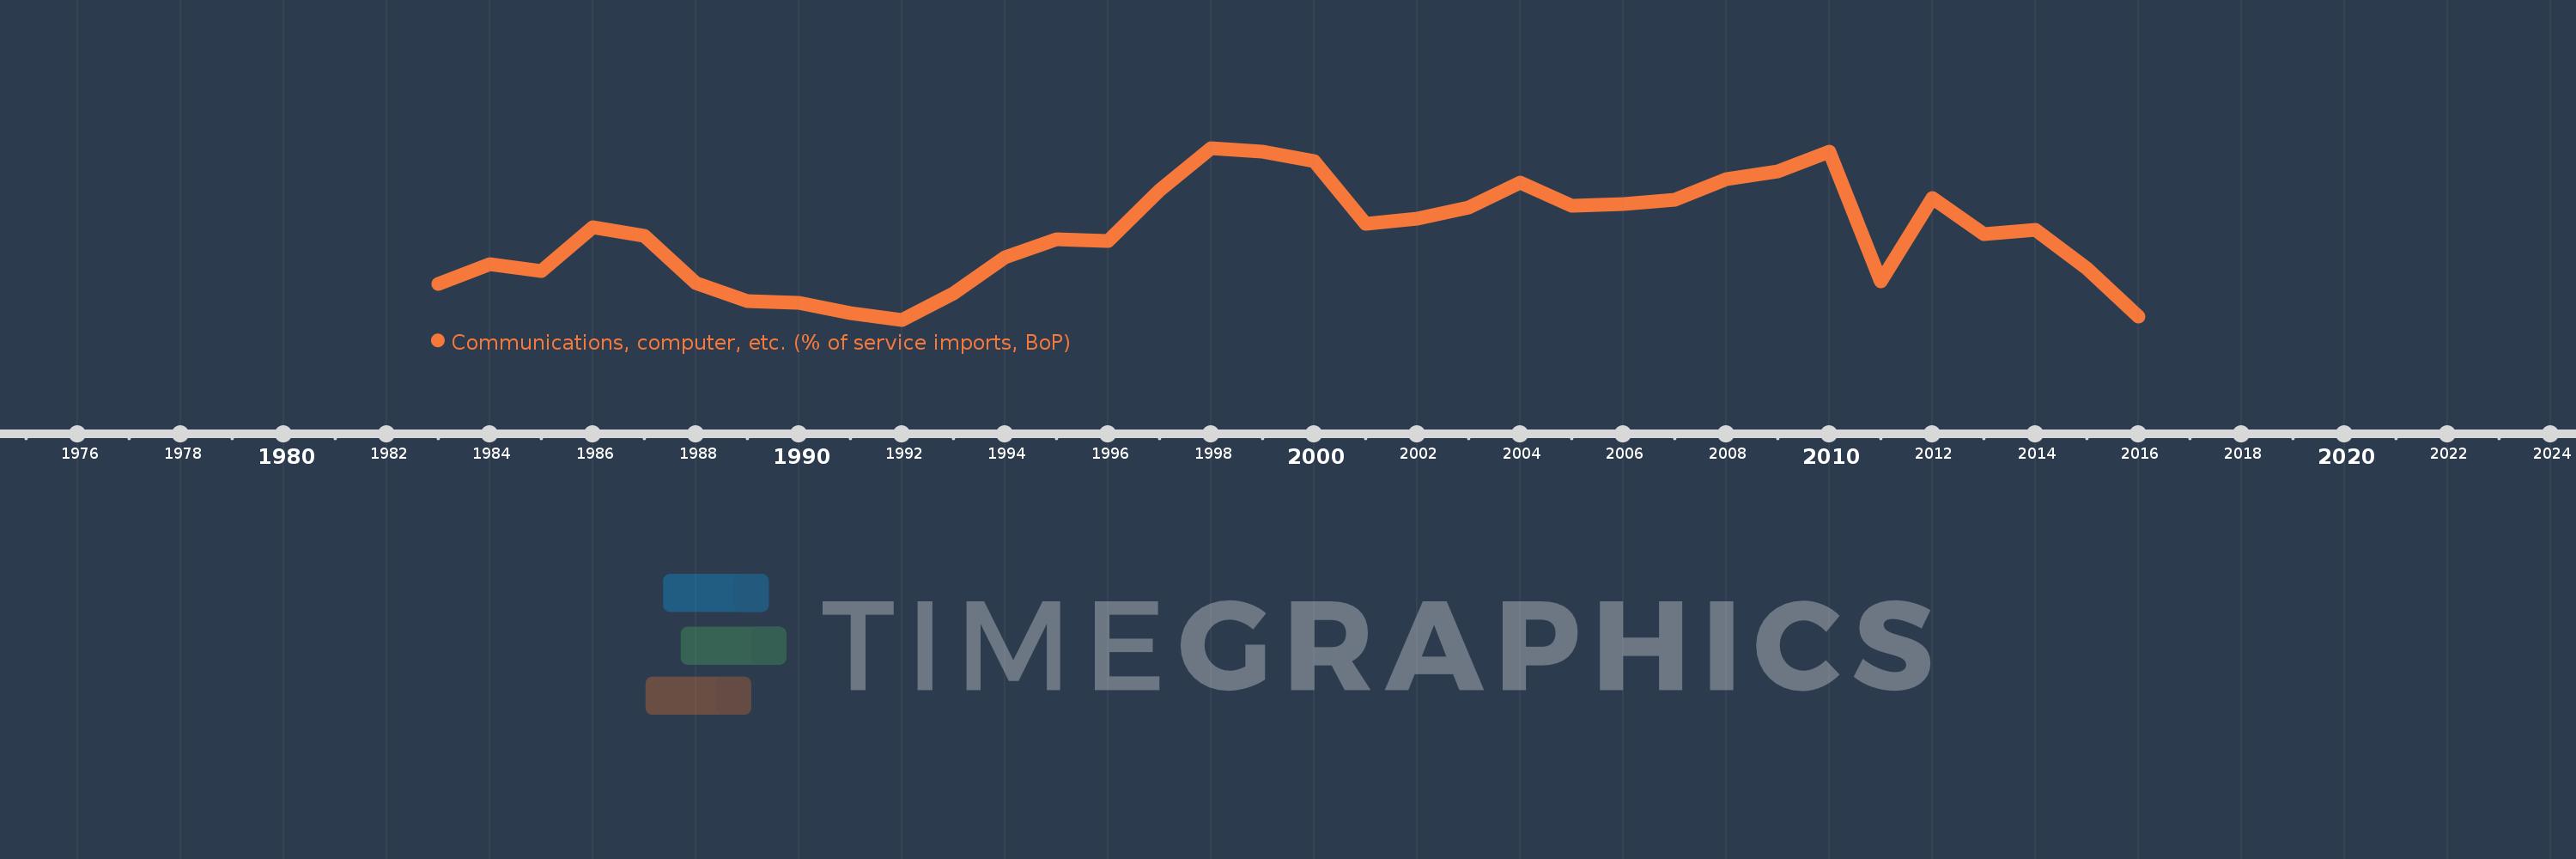
Communications, computer, etc. (% of service imports, BoP)
2016,2015,2014,2013,2012,2011,2010,2009,2008,2007,2006,2005,2004,2003,2002,2001,2000,1999,1998,1997,1996,1995,1994,1993,1992,1991,1990,1989,1988,1987,1986,1985,1984,1983
This statistics in other country:
AfghanistanAlbaniaAlgeriaAngolaAntigua and BarbudaArab WorldArgentinaArmeniaArubaAustraliaAustriaAzerbaijanBahamas, TheBahrainBangladeshBarbadosBelarusBelgiumBelizeBeninBermudaBhutanBoliviaBosnia and HerzegovinaBotswanaBrazilBrunei DarussalamBulgariaBurkina FasoBurundiCabo VerdeCambodiaCameroonCanadaCaribbean small statesCentral African RepublicCentral Europe and the BalticsChadChileChinaColombiaComorosCongo, Dem. Rep.Congo, Rep.Costa RicaCote d'IvoireCroatiaCuracaoCyprusCzech RepublicDenmarkDjiboutiDominicaDominican RepublicEarly-demographic dividendEast Asia & PacificEast Asia & Pacific (excluding high income)East Asia & Pacific (IDA & IBRD countries)EcuadorEgypt, Arab Rep.El SalvadorEquatorial GuineaEritreaEstoniaEthiopiaEuro areaEurope & Central AsiaEurope & Central Asia (excluding high income)Europe & Central Asia (IDA & IBRD countries)European UnionFaroe IslandsFijiFinlandFragile and conflict affected situationsFranceFrench PolynesiaGabonGambia, TheGeorgiaGermanyGhanaGreeceGrenadaGuatemalaGuineaGuinea-BissauGuyanaHaitiHeavily indebted poor countries (HIPC)High incomeHondurasHong Kong SAR, ChinaHungaryIBRD onlyIcelandIDA & IBRD totalIDA onlyIDA totalIndiaIndonesiaIran, Islamic Rep.IraqIrelandIsraelItalyJamaicaJapanJordanKazakhstanKenyaKiribatiKorea, Rep.KosovoKuwaitKyrgyz RepublicLao PDRLate-demographic dividendLatin America & Caribbean Latin America & Caribbean (excluding high income)Latin America & the Caribbean (IDA & IBRD countries)LatviaLeast developed countries: UN classificationLebanonLesothoLiberiaLibyaLithuaniaLow & middle incomeLow incomeLower middle incomeLuxembourgMacao SAR, ChinaMacedonia, FYRMadagascarMalawiMalaysiaMaldivesMaliMaltaMarshall IslandsMauritaniaMauritiusMexicoMicronesia, Fed. Sts.Middle East & North AfricaMiddle East & North Africa (excluding high income)Middle East & North Africa (IDA & IBRD countries)Middle incomeMoldovaMongoliaMontenegroMoroccoMozambiqueMyanmarNamibiaNepalNetherlandsNew CaledoniaNew ZealandNicaraguaNigerNigeriaNorth AmericaNorwayOECD membersOmanOther small statesPacific island small statesPakistanPalauPanamaPapua New GuineaParaguayPeruPhilippinesPolandPortugalPost-demographic dividendPre-demographic dividendQatarRomaniaRussian FederationRwandaSamoaSao Tome and PrincipeSaudi ArabiaSenegalSerbiaSeychellesSierra LeoneSingaporeSint Maarten (Dutch part)Slovak RepublicSloveniaSmall statesSolomon IslandsSouth AfricaSouth AsiaSouth Asia (IDA & IBRD)South SudanSpainSri LankaSt. Kitts and NevisSt. LuciaSt. Vincent and the GrenadinesSub-Saharan Africa Sub-Saharan Africa (excluding high income)Sub-Saharan Africa (IDA & IBRD countries)SudanSurinameSwazilandSwedenSwitzerlandSyrian Arab RepublicTajikistanTanzaniaThailandTimor-LesteTogoTongaTrinidad and TobagoTunisiaTurkeyTuvaluUgandaUkraineUnited KingdomUnited StatesUpper middle incomeUruguayVanuatuVenezuela, RBWest Bank and GazaWorldYemen, Rep.ZambiaZimbabwe Timeline:
This timeline shows a graph from 1983 to 2016 of IBRD only. No data until 1982. Number of actual observations by date: 34.
Source name:
World Development Indicators
Source organization:
International Monetary Fund, Balance of Payments Statistics Yearbook and data files.
Categories, topics:
Economy & Growth, Trade
Last updated:
apr 23, 2017
Indicators value changes by year
Minimum:
29.882
jan 1, 1992
Maximum:
37.623
jan 1, 1998
At the date of observation
Value
Absolute change
Change from previous value
jan 1, 1983
31.495
+31.495
0.0%
jan 1, 1984
32.405
+0.91
2.89%
jan 1, 1985
32.092
-0.314
-0.97%
jan 1, 1986
34.061
+1.969
6.14%
jan 1, 1987
33.658
-0.403
-1.18%
jan 1, 1988
31.547
-2.111
-6.27%
jan 1, 1989
30.721
-0.826
-2.62%
jan 1, 1990
30.66
-0.06
-0.2%
jan 1, 1991
30.183
-0.478
-1.56%
jan 1, 1992
29.882
-0.301
-1.0%
jan 1, 1993
31.053
+1.172
3.92%
jan 1, 1994
32.697
+1.644
5.29%
jan 1, 1995
33.497
+0.8
2.45%
jan 1, 1996
33.422
-0.076
-0.23%
jan 1, 1997
35.717
+2.295
6.87%
jan 1, 1998
37.623
+1.907
5.34%
jan 1, 1999
37.454
-0.169
-0.45%
jan 1, 2000
37.039
-0.415
-1.11%
jan 1, 2001
34.191
-2.848
-7.69%
jan 1, 2002
34.454
+0.263
0.77%
jan 1, 2003
34.96
+0.506
1.47%
jan 1, 2004
36.051
+1.091
3.12%
jan 1, 2005
35.011
-1.04
-2.88%
jan 1, 2006
35.091
+0.08
0.23%
jan 1, 2007
35.305
+0.213
0.61%
jan 1, 2008
36.23
+0.926
2.62%
jan 1, 2009
36.561
+0.33
0.91%
jan 1, 2010
37.441
+0.881
2.41%
jan 1, 2011
31.626
-5.815
-15.53%
jan 1, 2012
35.348
+3.722
11.77%
jan 1, 2013
33.752
-1.597
-4.52%
jan 1, 2014
33.939
+0.187
0.55%
jan 1, 2015
32.179
-1.76
-5.18%
jan 1, 2016
30.03
-2.149
-6.68%
Ranking of countries by current statistics by years


Comments: